A countdown of our top infographics from the last year, including some of our most viewed graphics as well as other hand-picked entries from our staff. Read more

In a complex world, the combined forces of data and visual communication take on new importance. See our top 20 visualizations for 2020. Read more

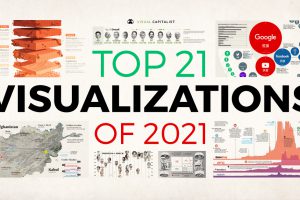
In this eighth edition of our yearly round-up, we highlight visualizations that broke new ground in design and data-driven reporting. Read more

