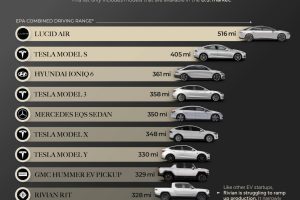
This infographic lists 10 of the longest range EVs currently for sale in the U.S. in 2023. The Lucid Air takes first place at 516 miles. Read more
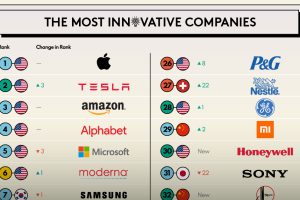
Which companies prioritize innovation the most? This infographic highlights BCG’s 2023 Most Innovative Companies ranking. Read more
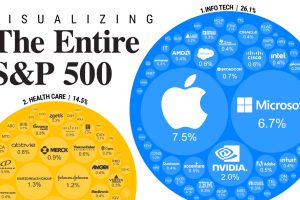
S&P 500 companies make up $34 trillion in market value combined. This graphic shows how they break down by weight and sector. Read more
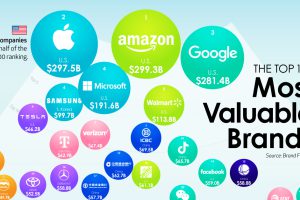
We show the top companies by brand value—and the brands that are rising the fastest as consumer expectations shift. Read more
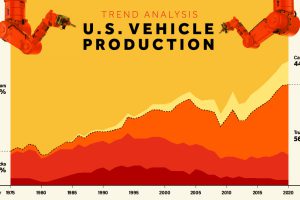
Visualize how U.S. vehicle production has shifted dramatically from cars to trucks, and especially to SUVs, since 1975. Read more
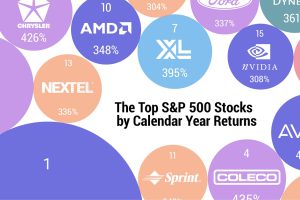
The highest one-year return among the top S&P 500 stocks from 1980 to 2022 was a staggering 2,620%. Which stocks top the ranks? Read more
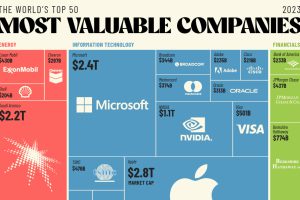
The world’s 50 most valuable companies represent over $25 trillion in market cap. We break this massive figure down by company and sector. Read more

SUVs and trucks were the best selling vehicle in almost every US state for 2022, but a few surprises remain. Read more
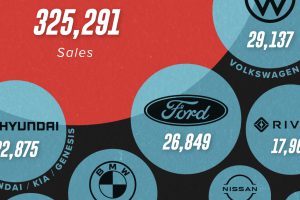
U.S. EV sales continue to be dominated by Tesla, which outsold all of its competitors combined in H1 2023. Read more


