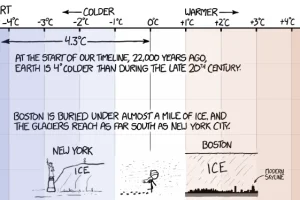
This simple and hilarious graphic is a must-see because of the excellent context it gives on changes in the earth’s temperature over the last 22,000 years Read more

We round up the most popular, most discussed, and most liked visualizations of the month on Voronoi, our new data storytelling platform. Read more

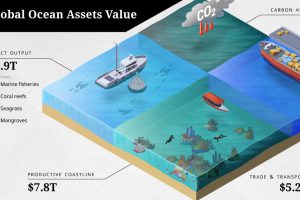
The ocean economy is under threat. How are human activities impacting the sustainable use of our ocean assets, valued at over $24 trillion? Read more

