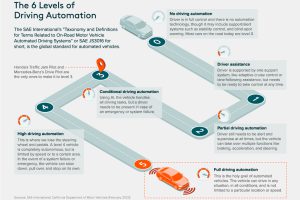
Automakers have spent $75 billion in the race to launch the first autonomous car, but just how close are we to ditching the steering wheel? (Sponsored post) Read more
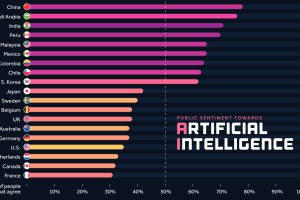
We visualize survey results from over 19,000 adults across 28 countries to see how attitudes towards AI differ around the world. Read more

We visualize the performance of ChatGPT in various professional and academic exams, highlighting the improvements of GPT-4 over GPT-3.5. Read more

Nearly 800,000 AI jobs were posted in the U.S. throughout 2022. View this graphic to see a breakdown by state. Read more
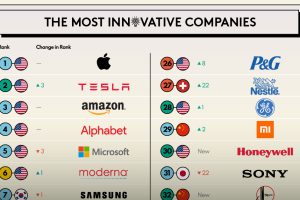
Which companies prioritize innovation the most? This infographic highlights BCG’s 2023 Most Innovative Companies ranking. Read more
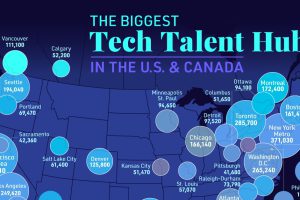
San Francisco and New York may be known as top tech talent hubs, but other cities are experiencing rapid growth in their tech labor pools. Read more
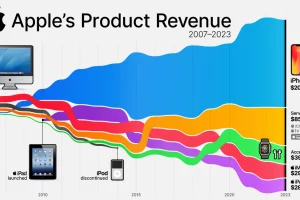
In 2023, iPhones accounted for more than half of Apple’s revenue. Read more
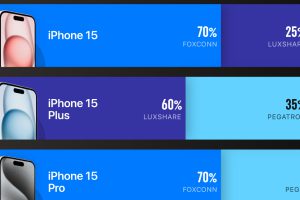
Foxconn produces roughly two out of every three iPhones. Read more
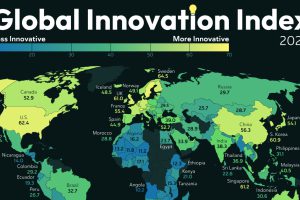
We visualized the results of WIPO’s GII 2024 to highlight the world’s most innovative countries in 2024. Read more


