Collectively, the Big Five tech giants combine for revenues of $802 billion, which is bigger than Saudi Arabia’s economy. Here’s how it breaks down. Read more

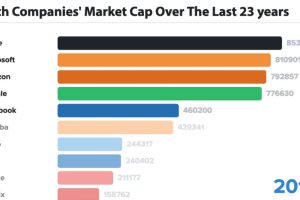
In business, the only constant is change – and for tech companies, this is even more true. Here are the biggest tech companies over 23 years. Read more

This infographic explores how the music streaming industry generates almost half of the global music market’s $19.1 billion in revenue. Read more

Nearly half the world has tapped into the social media universe. Monthly Active Users (MAUs) quantifies the success of these giant platforms. Read more

By embracing uncertainty and making timely pivots, we visualize the bizarre origin stories of the most successful tech companies today. Read more

Big Tech just keeps on getting bigger. How much do the FAATMAN companies generate in revenues per minute? Read more

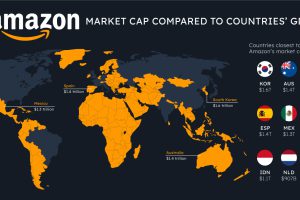
How do the big tech giants compare to entire countries? Here’s how Apple, Microsoft, and Amazon’s market caps stack up against national GDP. Read more

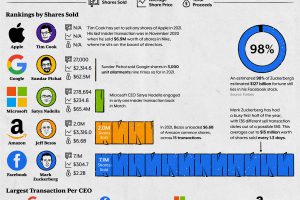
Big Tech is worth trillions, but what are insiders doing with their stock? We breakdown Big Tech CEO insider trading during the first half of 2021. Read more

A lot has changed since Yahoo and AOL were the homepages of choice. This visualization looks at the largest internet giants in the U.S. since 1998. Read more


