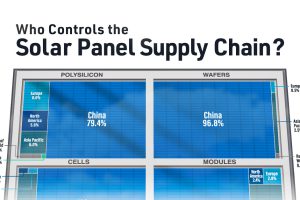
The supply chain is key for the renewable energy revolution, and this chart visualizes where the world’s solar panels are manufactured. Read more

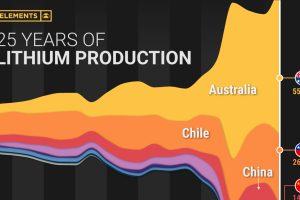
Lithium production has grown exponentially over the last few decades. Which countries produce the most lithium, and how how has this mix evolved? Read more

Cargo that moves through airports represents the value of around 35% of world trade. These hubs move the most cargo globally. Read more

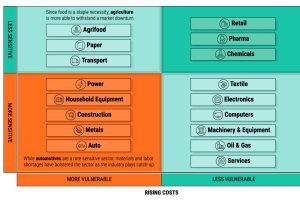
We show the sectors with the lowest exposure to recession risk—and the factors that drive their performance. Read more

