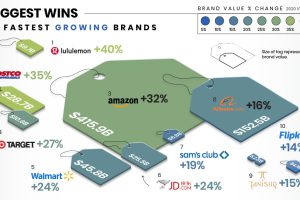
This infographic illustrates how the fastest growing and declining retail brands are attempting to stay relevant in the pandemic economy. Read more
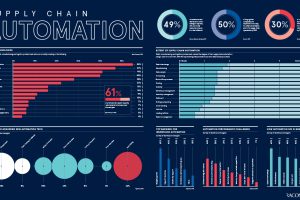
As COVID-19 disrupts global supply chains, we take a look at how industries are investing in automation—and what this is tells us about the future. Read more
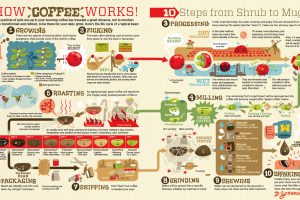
How does coffee get from a faraway plant to your morning cup? See the great journey of beans through the coffee supply chain. Read more
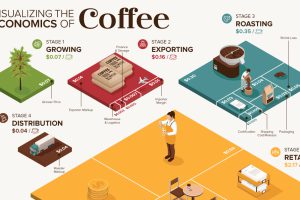
What makes your cup of coffee possible, and how much does it really cost? Here’s how the $200B coffee supply chain breaks down economically. Read more
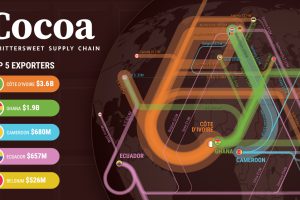
The cocoa supply chain is a bittersweet one. While chocolate is a beloved sweet treat globally, many cocoa farmers are living a bitter reality. Read more
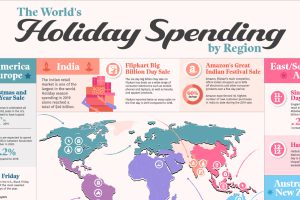
This graphic illustrates some of the largest and most anticipated retail holidays by region and explores their origins. Read more
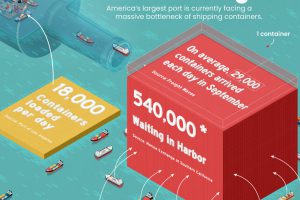
The Port of Los Angeles is the busiest port in America. It’s also at the center of a massive container backlog. Read more
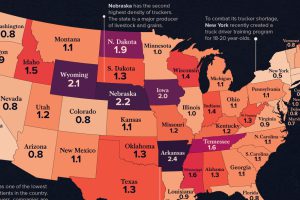
See how America’s 1.8 million truckers are distributed across the nation in these two heatmap visualizations. Read more
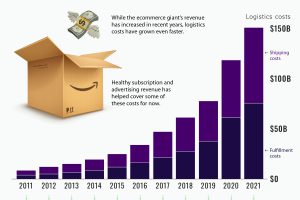
Amazon’s shipping costs have surged to over $150 billion – a number that has almost doubled since the start of the pandemic. Read more


