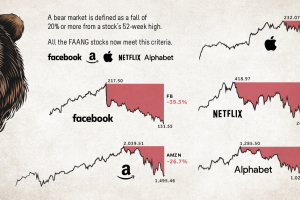
All five tech giants are now officially in a bear market – we visualize the damage to the FAANG stocks and the wider market, and evaluate the situation. Read more
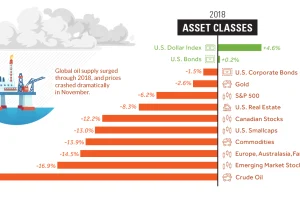
Investors saw a sea of red in 2018 – here’s a visual recap of how markets performed, including the big winners and losers from a volatile year. Read more
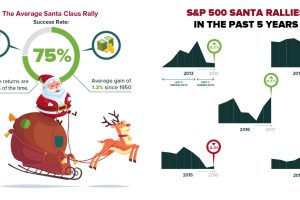
Here’s the historical data on the fabled Santa Claus Rally that occurs in the stock market, and how things are shaping up so far this holiday season. Read more
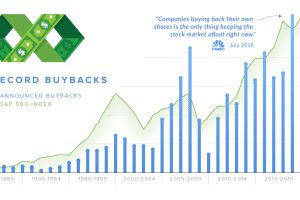
In 2018, companies announced over $1 trillion in stock buybacks. We explain what the proponents and detractors of buybacks are arguing about. Read more
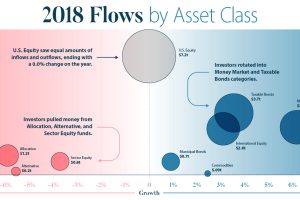
This infographic breaks down investment flows into funds (mutual funds, ETFs, etc.) over the course of 2018 to show how and when investors changed strategies. Read more
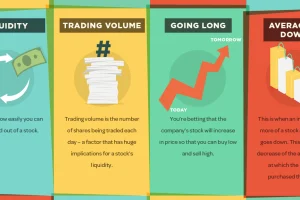
Getting a grasp on the market can be a daunting task for new investors, but this infographic is an easy first step to help in understanding stock market terms. Read more
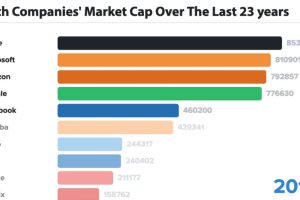
In business, the only constant is change – and for tech companies, this is even more true. Here are the biggest tech companies over 23 years. Read more
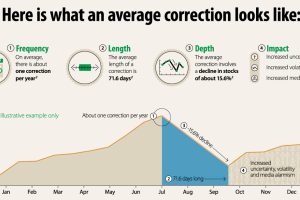
Why do stock market corrections happen, and how often does a market correction turn into a bear market? This infographic breaks it all down. Read more

We breakdown the world’s largest stock markets by country, highlighting the massive growth of the U.S. and Asia. Read more
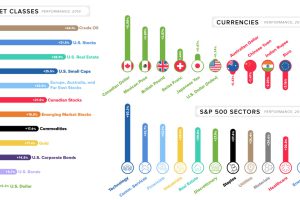
This quick graphic summary breaks down the final market numbers for 2019, looking at everything from currencies to broad asset classes. Read more

