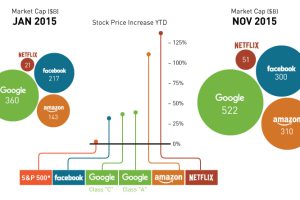
The FANG stocks (Facebook, Amazon, Netflix, and Google) are a group of tech companies that have carried the market this year, creating $440B in value YTD. Read more
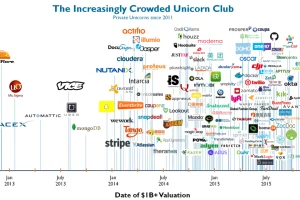
The elite group of startups worth over $1 billion – the unicorn club – is becoming increasingly crowded. Will it continue to remain frothy for investors? Read more
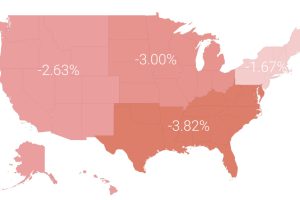
In a volatile market in 2015, the average investor lost 3.1%. In today’s post, we break this performance down by region, profession, and age. Read more
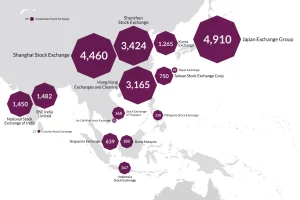
There’s 60 major stock exchanges in the world, ranging from the mighty NYSE to the tiny Bermuda stock market. Here they all are visualized by size and location. Read more
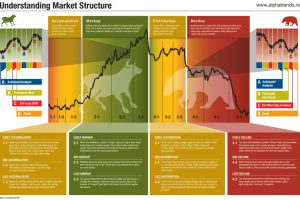
Understanding these different phases of the market cycle will help give you conviction on stock buying opportunities. Read more
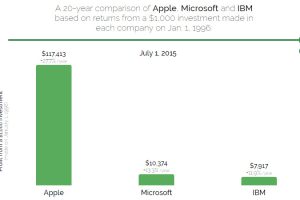
Going back 20 years, which stock would you buy? It turns out to be not even close between Apple and Microsoft. Read more
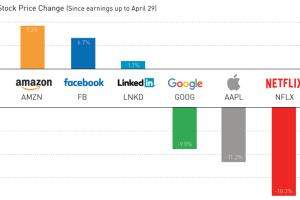
Earnings season has been a roller coaster for the world’s biggest tech companies. We sum up the action in today’s chart. Read more
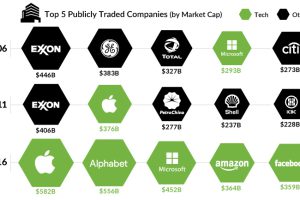
What are the largest companies by market cap, and how have they changed over the years? This chart shows them, while also presenting a broader narrative. Read more
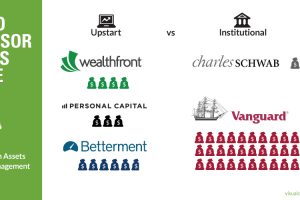
Can upstart robo-advisors compete against the scale of financial behemoths like Vanguard or Blackrock? See in this week’s chart. Read more
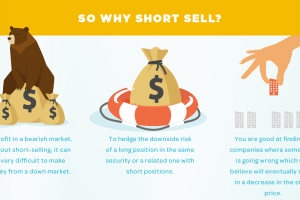
A look at the potential risks and added costs of short selling, but also an explanation where the practice may make sense for some investors. Read more

