BlackRock is the world’s largest asset manager, with over $9 trillion in holdings. Here are the company’s top equity holdings. Read more
This infographic visualizes 10-year annualized forecasts for both equities and fixed income using data from Vanguard. Read more
The highest one-year return among the top S&P 500 stocks from 1980 to 2022 was a staggering 2,620%. Which stocks top the ranks? Read more
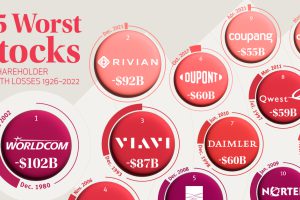
Among publicly-listed U.S. companies, the 25 worst stocks have lost shareholders a collective $1.2 trillion since 1926. Read more
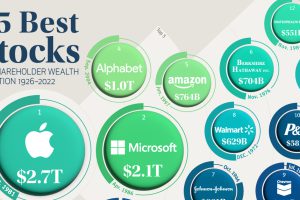
Accounting for just 0.1% of all public U.S. stocks, these companies have created nearly a third of all shareholder wealth since 1926. Read more
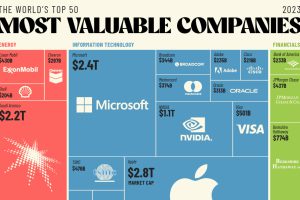
The world’s 50 most valuable companies represent over $25 trillion in market cap. We break this massive figure down by company and sector. Read more
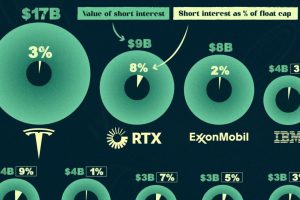
In this infographic, we list the 15 most shorted stocks in the U.S. in the Fall of 2023, ranked by the value of their short interest. Read more
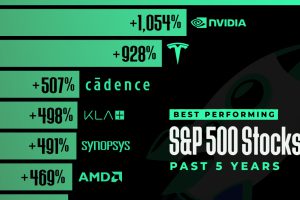
In this graphic, we’ve ranked the top S&P 500 stocks based on their 5-year total returns, as of November 2023. Read more
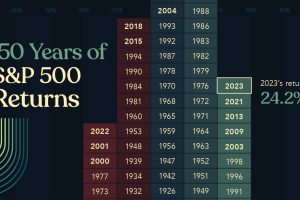
Last year, U.S. stocks took investors by surprise. This graphic shows S&P 500 historical returns since 1875 to put 2023 returns into context. Read more


