
How have state populations changed over a century? This bump chart shows the population rank of every state in the United States over 1917-2017. Read more

Which state could be hit hardest by a trade war? Here is every U.S. state organized by total economy size, and the share tied to international trade. Read more
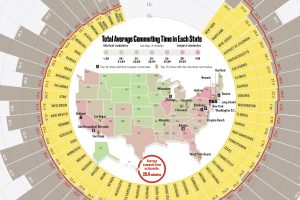
This infographic compares all U.S. states by average commute time, while also listing the top 10 cities with the longest and shortest commutes in the country. Read more
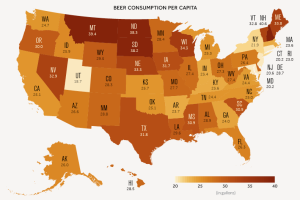
A data-driven look at consumption of America’s most popular alcoholic beverage: beer. Read more
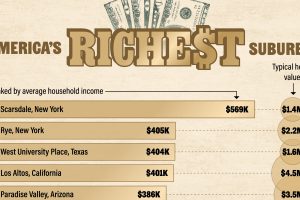
This graphic ranks the top 10 wealthiest suburbs in America, seeing the most entries from California, Texas, and New York. Read more
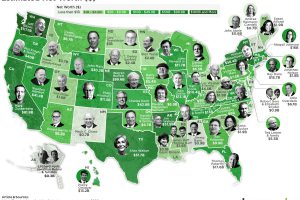
The biggest state fortunes range from $0.3 billion to $117.1 billion (Jeff Bezos). See the wealthiest person in every U.S. state on this map. Read more
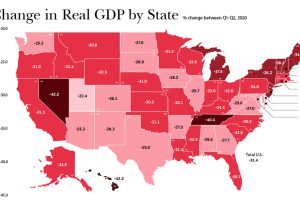
In just a few months, the U.S. economy reeled from COVID-19. As real change in GDP suffered, which states and industries were the hardest-hit? Read more

A vast majority raise the most through general and selective sales taxes. Here’s the single largest source of tax revenue for all 50 states. Read more
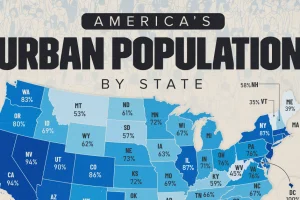
About 80% of the U.S. lives in cities. That’s 264 million people. But how does it vary per state? We investigate. Read more
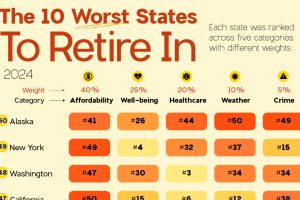
The worst states to retire in are those that are expensive and cold. But there’s a surprising warm weather entry as well. Read more

