Here’s how investor sentiment has shifted over the last three decades, from the Dotcom boom to present-day. Read more
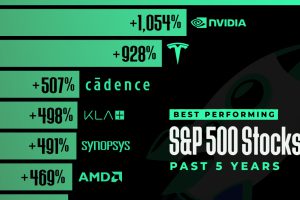
In this graphic, we’ve ranked the top S&P 500 stocks based on their 5-year total returns, as of November 2023. Read more
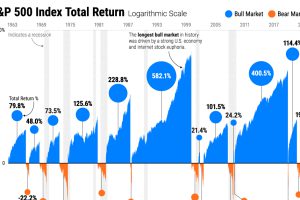
Stock market cycles often rhyme throughout history, shaped by monetary policy, consumer spending, and herd behavior. Read more
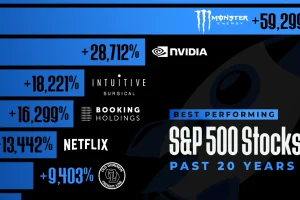
Which S&P 500 stocks have seen the highest returns over the last two decades? This graphic shows the top 15 performers. Read more
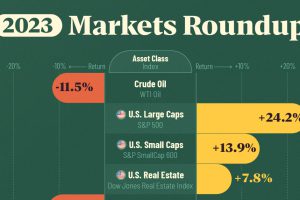
Between equities, real estate, commodities, bonds, and emerging markets, we track which major asset class ended the year on a positive note. Read more
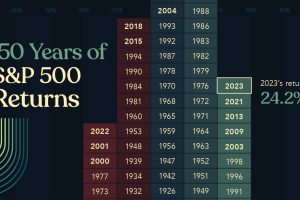
Last year, U.S. stocks took investors by surprise. This graphic shows S&P 500 historical returns since 1875 to put 2023 returns into context. Read more
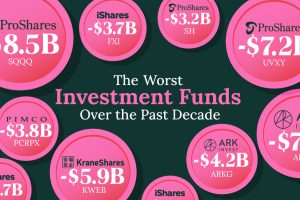
The 12 worst investment funds have destroyed $56 billion in shareholder wealth over the past decade, as of Dec. 2023. Read more
Which of the Big Four accounting firms take home the most audit fees from their S&P 500 clients? Read more


