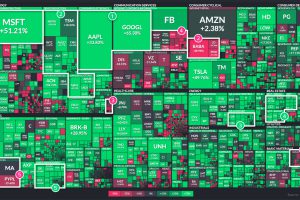
2021 was yet another tumultuous year. Which stock market sectors thrived during the twists and turns of the last 12 months, and which faltered? Read more
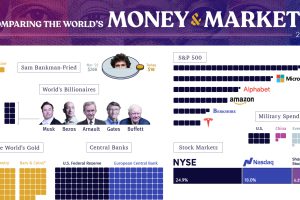
From the wealth held to billionaires to all debt in the global financial system, we look at the vast universe of money and markets in 2022. Read more

The markets in 2022 were characterized by a lot more pain than gain. That said, there were winners to be found, even during a turbulent year Read more
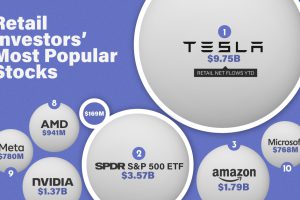
This infographic lists the 10 most popular stocks (or ETFs) that retail investors have been buying in 2023 so far. Read more
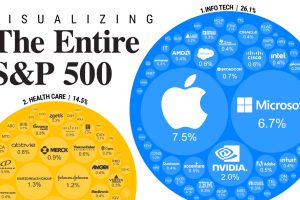
S&P 500 companies make up $34 trillion in market value combined. This graphic shows how they break down by weight and sector. Read more
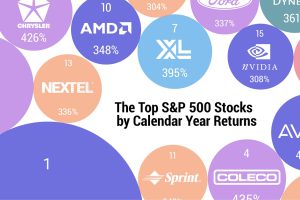
The highest one-year return among the top S&P 500 stocks from 1980 to 2022 was a staggering 2,620%. Which stocks top the ranks? Read more
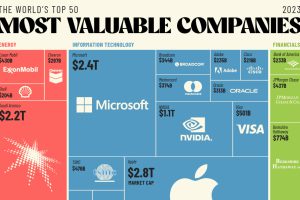
The world’s 50 most valuable companies represent over $25 trillion in market cap. We break this massive figure down by company and sector. Read more
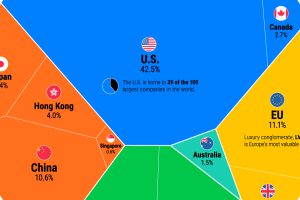
We show the entire global stock market in 2023, illustrating the dominance of U.S. markets. But as structural dynamics shift, will this last? Read more

This graphic reveals the top 20 highest paid CEOs in the S&P 500 from Sundar Pichai to Jamie Dimon. Read more
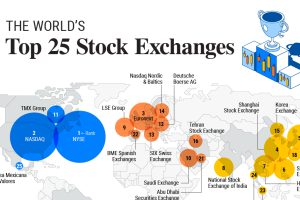
Here are the top 25 largest stock exchanges in the world, worth a combined $106 trillion in market capitalization in 2023. Read more

