

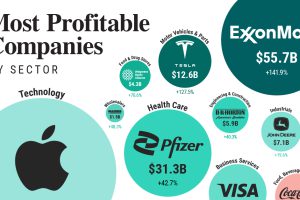
From Apple to Home Depot, we show America’s most profitable companies in their sector at a time of elevated inflation. Read more
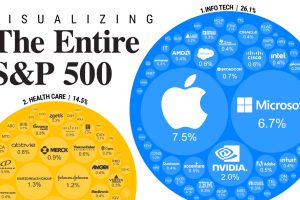
S&P 500 companies make up $34 trillion in market value combined. This graphic shows how they break down by weight and sector. Read more
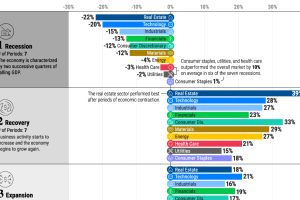
We show the best performing S&P 500 sectors over each phase of the business cycle using nearly seven decades of data. Read more
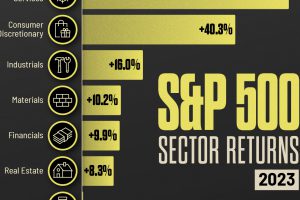
Companies benefitting from the AI train and strong retail demand helped their individual S&P 500 sector performance in 2023. Read more