

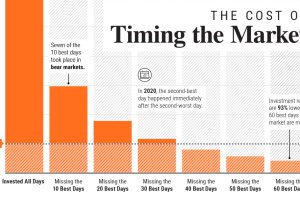
In this graphic, we show why timing the market is extremely difficult, and how it can meaningfully dent portfolio returns. Read more
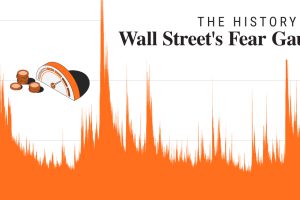
In 2023, market volatility has fallen dramatically. In this graphic, we show how it compares to historical trends. Read more
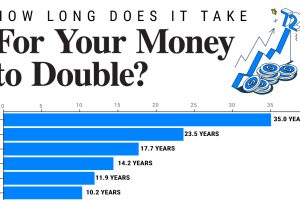
Since 1949, the S&P 500 has doubled in value 10 times. We show how long it takes to double your money across a range of annualized returns. Read more