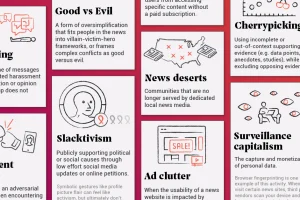
In this infographic, we catalog 33 problems with the social and mass media ecosystem. Read more

Believe it or not, we’ve been swiping for a decade now. Here’s a look at ten years of Tinder’s business in the world of dating apps. Read more

What major stories have captured the world’s attention over the years? This graphic highlights the top trending Google searches since 2001. Read more
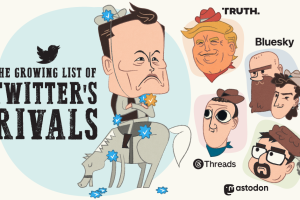
Discover the five rising apps eating away at Twitter’s market share, from Meta’s new Threads app to the open-source platforms BlueSky and Mastodon. Read more
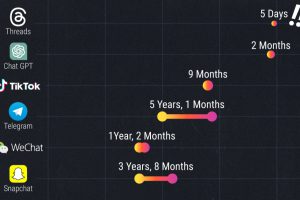
Threads reached 100 million users in just five days. Here is a timeline of how long other popular platforms took to reach the milestone. Read more
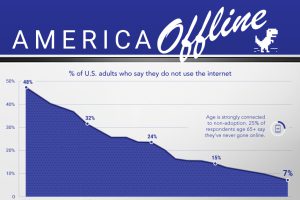
Internet adoption is widespread in the U.S. In fact, only 7% of Americans do not use the internet. Who are these non-adopters? Read more
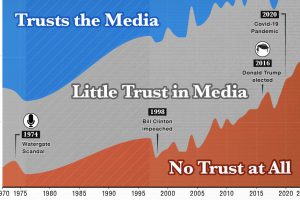
Media trust among Americans has reached its lowest point since Trump won the 2016 presidential election. Read more
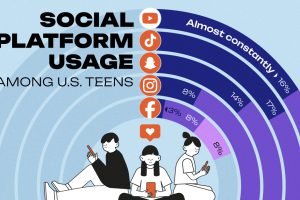
This graphic analyzes social platform usage among U.S. teenagers (13-17 years old), using data from a recent Pew Research study. Read more


