Explore the social media universe in this giant infographic, where every platform is a planet sized based on the amount of users it has. Read more
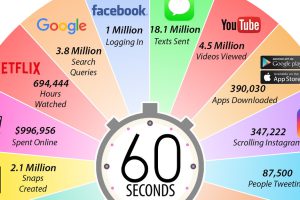
In every internet minute, there is an extraordinary amount of activity. Wrap your head around it all with this nifty infographic. Read more
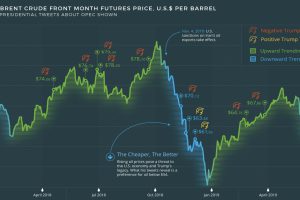
What goes through the head of a U.S. president? The tweets of U.S. President Donald Trump reveal a contentious relationship with the price of oil and OPEC. Read more
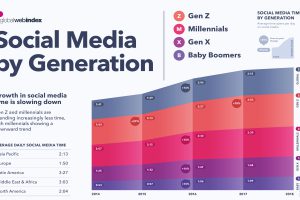
Every generation has the same desire for connection, but the way in which we connect over social media differs across age groups and regions. Read more
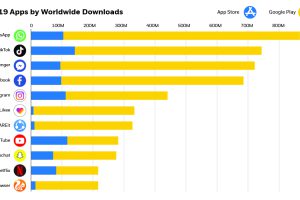
The app economy is expected to be over $6 trillion by 2021—see the world’s most downloaded apps and how they’re driving the future of this market. Read more
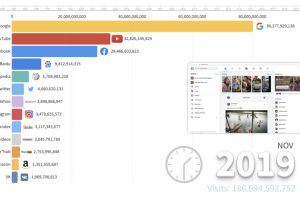
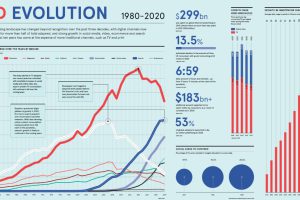
This animation provides an interesting overview of the websites with the highest traffic over the last few decades, and how the rankings have changed. Read more
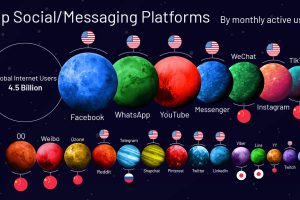
Nearly half the world has tapped into the social media universe. Monthly Active Users (MAUs) quantifies the success of these giant platforms. Read more
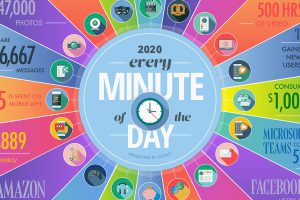
A lot can happen in an internet minute. This graphic looks at the enormous numbers behind the online services billions use every day. Read more
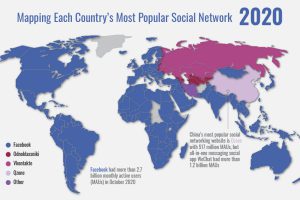
Mapping the rapid expansion of Facebook into the world’s dominant social network, and the countries and platforms resisting its growth Read more


