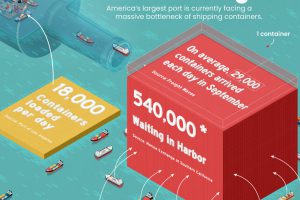
The Port of Los Angeles is the busiest port in America. It’s also at the center of a massive container backlog. Read more
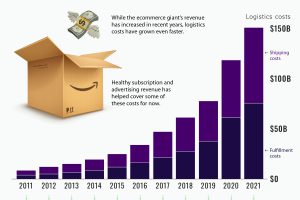
Amazon’s shipping costs have surged to over $150 billion – a number that has almost doubled since the start of the pandemic. Read more
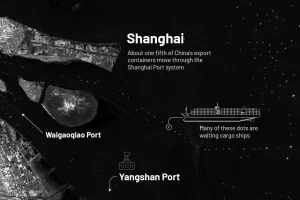
China’s lockdown of Shanghai is causing massive back-ups at the world’s largest container port. Hundreds of ships are now waiting at sea. Read more
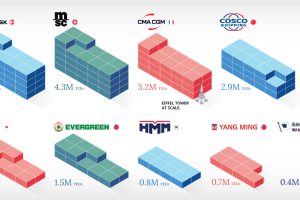
In this infographic, we rank the world’s 10 largest maritime shipping companies by container capacity and fleet size. Read more
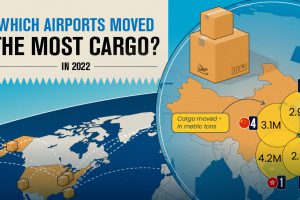
Cargo that moves through airports represents the value of around 35% of world trade. These hubs move the most cargo globally. Read more

From cultural events that dominated headlines to geopolitical shifts and clashes, what major events defined 2023? Read more
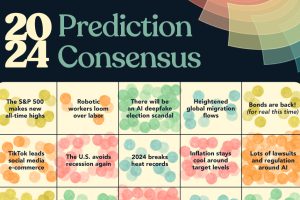
Using our database of 700+ forecasts from reports, articles, interviews, and more, we highlight what experts think will happen in 2024. Read more
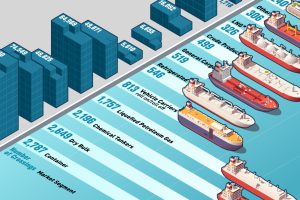
This graphic illustrates Panama Canal traffic by shipment category, looking at the total number of shipping crossings and the total tonnage. Read more
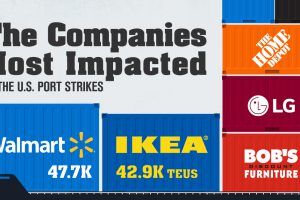
The historic port strike is set to disrupt up to 49% of U.S. imports. Here are the companies most at risk, ranked by import volume. Read more

