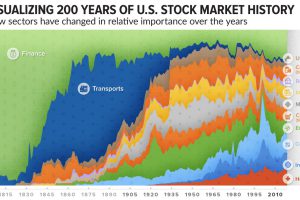
How has the composition of the market changed over time? This incredible chart plots U.S. stock market sectors over 200 years to reveal how much it’s changed. Read more

This treemap visualization shows the best and worst performing sectors of the stock market in 2020. We break down the winners and losers. Read more

The 100 biggest companies in the world were worth a record-breaking $31.7 trillion as of the end of Q1, up 48% year-over-year. Read more

2021 was yet another tumultuous year. Which stock market sectors thrived during the twists and turns of the last 12 months, and which faltered? Read more

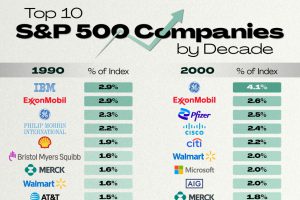
We look at the top S&P 500 companies since 1990 to highlight how the American economy has evolved over time. Read more

