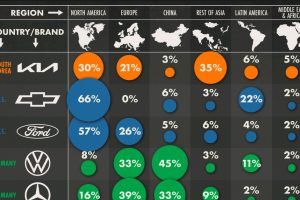
We visualized automaker sales by region to identify the biggest markets for brands like Ford and BMW. Read more
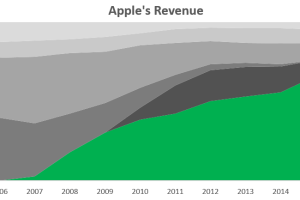
With iPhone sales making up over 60% of revenue, investors are becoming increasingly worried that Apple is a one trick pony. Read more
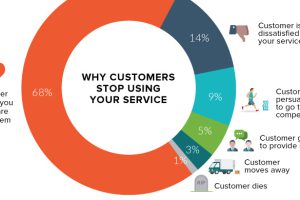
An astonishing two-thirds of your customers leave because they think you don’t care about them. Here’s how to change that. Read more
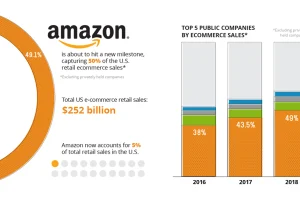
Amazon now accounts for nearly 50% of all U.S. ecommerce sales. This is more than double that of Amazon’s next nine biggest competitors, combined. Read more
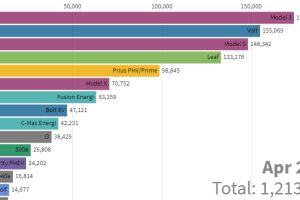
This stunning animation visualizes the last nine years of U.S. electric vehicle sales. We also look at who will lead the race in the coming years. Read more
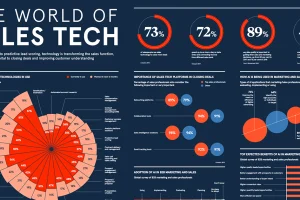
Sales technology tools today use AI to create personalized sales and marketing campaigns to find better prospects and close more leads. Read more

From rooms to revenue, this infographic breaks down the numbers behind the business of Airbnb—one of the most successful IPOs of 2020. Read more

A vast majority raise the most through general and selective sales taxes. Here’s the single largest source of tax revenue for all 50 states. Read more
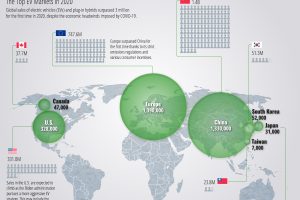
Europe was the global leader in EV sales for the first time in 2020, surpassing China by a thin margin of just 60,000 cars. Read more

Reimagining all 200 million of the American workforce as 100 people: where do they all work, what positions they hold, and what jobs they do? Read more

