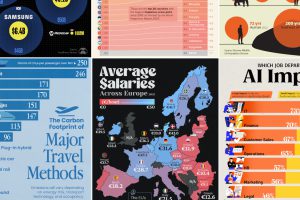
We round up the most popular, most discussed, and most liked visualizations of the month on Voronoi, our new data storytelling platform. Read more

We round up the most popular, most discussed, and most liked visualizations of the month on Voronoi, our new data storytelling platform. Read more

The interactive graphic helps us to visualize the relationship between the supply and demand for over 1,400 technology skills. Read more

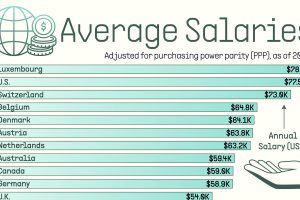
See how average annual salaries vary across 30 different countries, adjusted for purchasing power parity (PPP). Read more

This infographic shows the net minimum wage across 67 countries, as of January 2023. A breakdown by U.S. state is also included. Read more

