

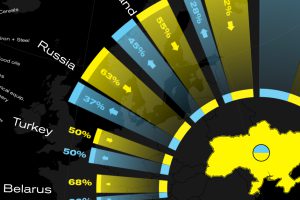
This graphic visualizes Ukraine’s top international trading partners and the country’s most exported and imported products in 2020. Read more
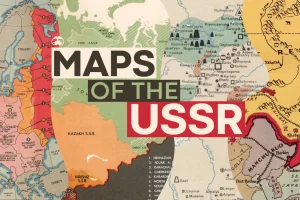
These historical maps tell the story of the USSR, and how its territorial expansion and contraction is linked to present day geopolitical events. Read more
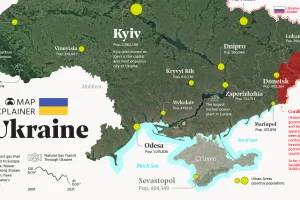
Ukraine has made the headlines due to the ongoing tensions with Russia. In this map infographic, we examine Ukraine from a structural point of view. Read more
Nuclear weapons have devastating effects, but the science of how they work is atomically small. So, how do nuclear weapons work? Read more

Here’s how the global community voted on the resolution: In favor – 93 | Abstained – 58 | Against – 24 Read more

Explore North America’s crude oil pipelines and refineries across the U.S. and Canada in our interactive map. Read more
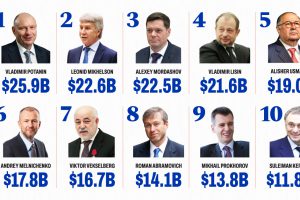
Russian billionaires have lost more than $38 billion in 2022 because of Western sanctions on Russia in reprisal for the invasion of Ukraine. Read more
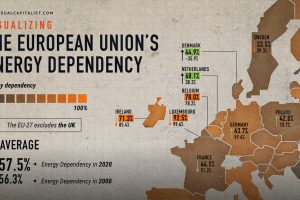
The EU’s energy dependency has become a major issue amid Russia’s invasion of Ukraine. See what the data says in this infographic. Read more

Russia faces a multitude of U.S. sanctions for its participation in global conflicts. This infographic lists who and what has been impacted. Read more
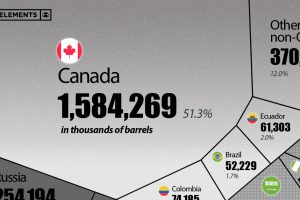
This visualization breaks down U.S. oil imports by country for 2021, showing the split by OPEC and non-OPEC nations. Read more