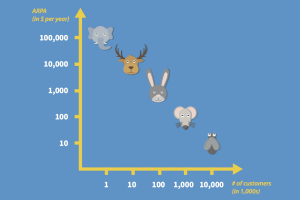
Is your revenue model to get millions of ‘flies’, or just a few big ‘elephants’? This infographic looks at five different ways to hit $100 million in revenue. Read more
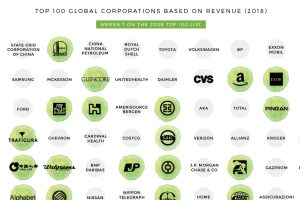
This nifty animated chart shows how the list of the world’s biggest companies by revenue have changed over the last decade. Read more
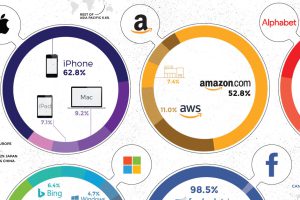
Collectively, the Big Five tech giants combine for revenues of $802 billion, which is bigger than Saudi Arabia’s economy. Here’s how it breaks down. Read more
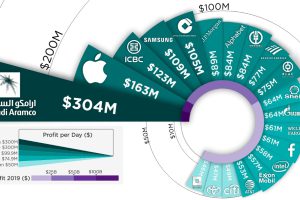
Saudi Aramco, the state oil producer in Saudi Arabia, rakes in $304 million of profit per day – putting it atop the list of the world’s most profitable companies. Read more
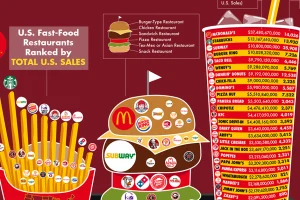
Every year, fast food chains rake in north of $200 billion in revenue per year. Here are the biggest chains, ranked by revenue and number of locations. Read more
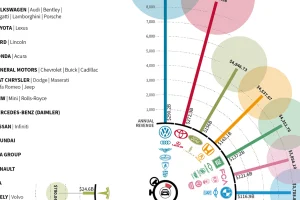
The world’s largest automakers generate a staggering amount of revenue. In fact, in the time it took you to read this, Volkswagen earned over $50,000. Read more
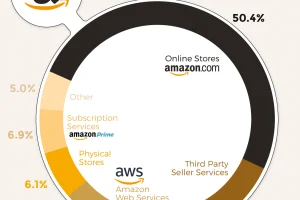
In 2019, Amazon generated $281 billion in total revenue—but where does all this revenue come from? Here’s a breakdown of how Amazon makes its money. Read more

What’s America been craving? Here’s a look at the top 50 most popular fast food chains, ranked by U.S. sales in 2019. Read more
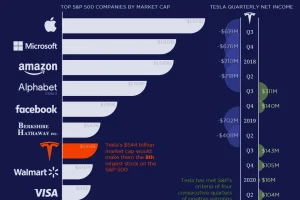
When Tesla enters the S&P 500, the company will immediately be one of the top 10 largest by market capitalization. Read more

This graphic compares consumers’ most loved brands before the COVID-19 pandemic to their most loved brands during the pandemic. Read more

