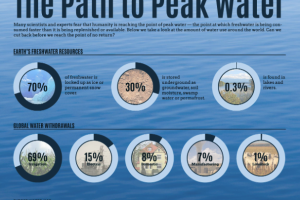
Water is the lifeblood of humanity; it turns out it is in short supply. Like any other commodity high in demand, you should keep an eye on it for investment… Read more
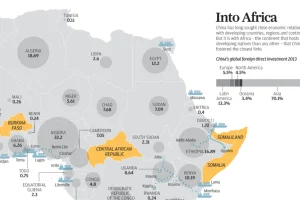
Over the last decade, China has poured billions of dollars of investment into the African continent. See this information visualized. Read more
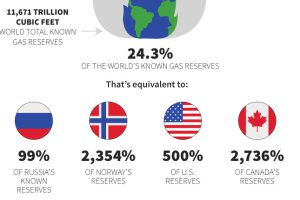
The Arctic is one of the last resource frontiers, and it is home to untapped amounts of resource wealth: oil, gas, and minerals. See how much could be there Read more
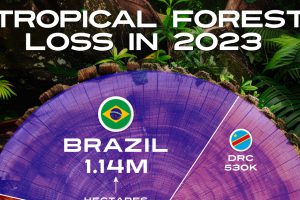
The world lost the equivalent of almost ten soccer fields of tropical forest per minute last year. Read more
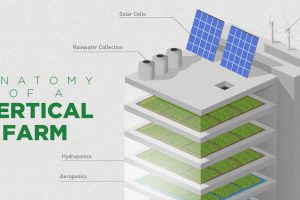
What if a skyscraper could supply sustainable farm food to the city more efficiently and profitably? This infographic explains how vertical farming works. Read more
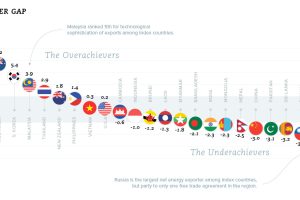
Charting the most influential countries in Asia, plus a look at the countries that punch above their weight class, in terms of power and influence. Read more
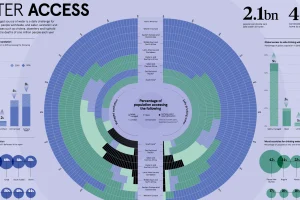
Water is the world’s most precious commodity. Yet, an estimated $260 billion is lost globally each year from the lack of basic water access and sanitation. Read more
With so much misinformation spreading on the pandemic, we’ve compiled a quality list of data-driven and unbiased COVID-19 resources for you to use. Read more
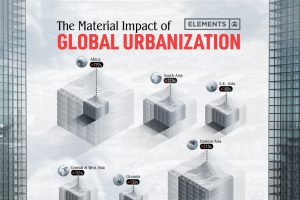
The world’s material consumption is expected to grow from 41 billion tonnes in 2010 to about 89 billion tonnes by 2050. This graphic shows the impact of urbanization. Read more
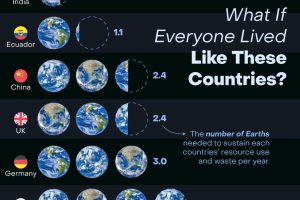
How many Earths would we need if the global population lived like Americans? This infographic answers this question and more. Read more

