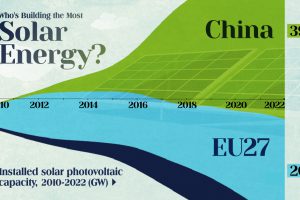
China’s solar capacity triples USA, nearly doubles EU. Read more
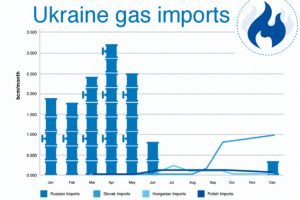
Looking back on 2014, this infographic sums up the major changes occurring in energy markets in oil, renewables, sanctions, and more. Read more
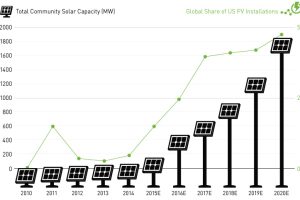
New installations of community solar farms are taking off, with cumulative capacity in the United States to increase sevenfold over the next two years. Read more
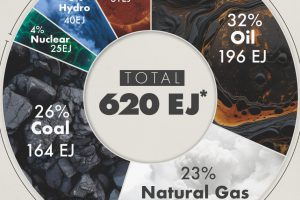
This graphic shows the sources of energy used globally in 2023, measured in exajoules, with fossil fuels making up 81% of the energy mix. Read more
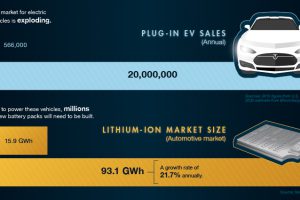
The explosion in demand for electric cars means we need more batteries. But where do the raw materials of batteries come from, and do we have enough? Read more
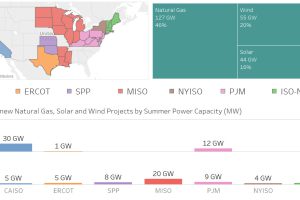
Nearly 100 GW of new power coming online is from solar and wind, making up 36% of new electrical capacity being added in these jurisdictions. Read more
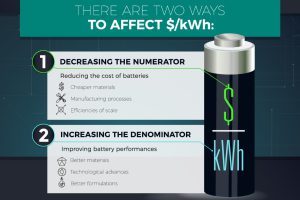
What’s the best way to reduce the $/kWh of li-ion batteries? Historically, it’s by advances in the cathode, and that may be the case for the future as well. Read more
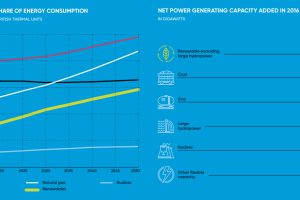
In 2016, more net capacity was added for clean energy than all other types combined. Who’s adding renewable capacity, and how much are they investing? Read more


