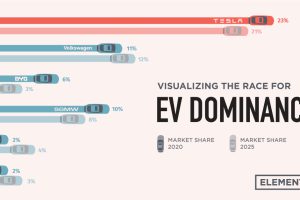
Tesla was the first automaker to hit a $1 trillion market cap, but other electric car companies have plans to unseat the dominant EV maker. Read more
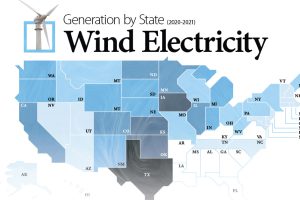
Wind energy is the largest source of renewable electricity in North America. This graphic maps U.S. states by wind electricity generation. Read more

Renewable energy is the foundation of the ongoing energy transition. What are the key types of renewable energy, and how do they work? Read more
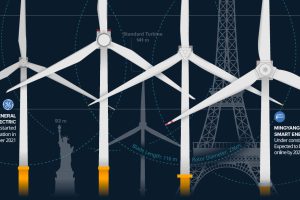
The biggest wind turbines can reach over 200 meters and cost more than $12 million to manufacture and install. Read more

The supply chain is key for the renewable energy revolution, and this chart visualizes where the world’s solar panels are manufactured. Read more
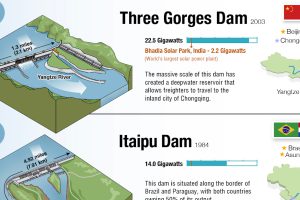
Hydroelectric dams generate 40% of the world’s renewable energy, the largest of any type. View this infographic to learn more. Read more
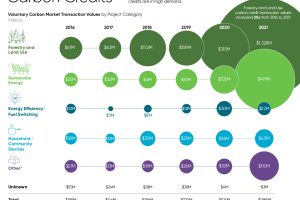
Carbon credits from nature-based solutions are in high demand as organizations look to shrink their carbon footprints. Read more
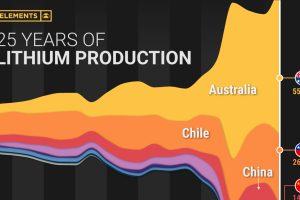
Lithium production has grown exponentially over the last few decades. Which countries produce the most lithium, and how how has this mix evolved? Read more
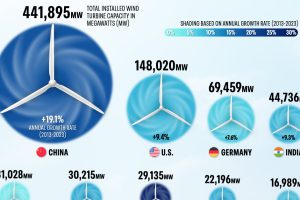
Global wind power capacity hit fresh records in 2023 thanks to strategic government investment and lower technology costs. Read more

This graphic describes new U.S. renewable energy installations by state along with nameplate capacity, planned to come online in 2023. Read more

