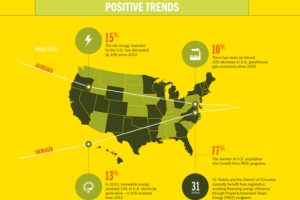
Explaining recent advances in renewable energy such as organic solar cells and concentrated solar. Read more
This infographic shows how five global brands are already using large amounts of renewable energy, including Microsoft, Google, Ikea, Sony, and Walmart. Read more
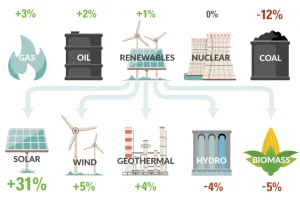
How is U.S. energy consumption shifting? This week’s chart looks at the rate of change in the use of different energy sources, including future projections. Read more
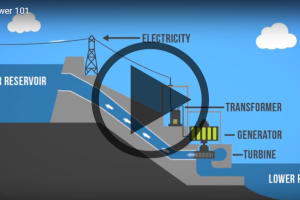
Want to learn about how different energy sources work? Check out these short, fact-driven videos on topics like oil, hydro, solar, wind, LNG, or fracking. Read more

This infographic shows the many technological advances made throughout the history of solar energy – going all the way back to the Neolithic Era in China. Read more
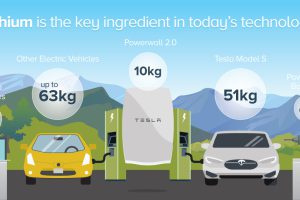
How is lithium-ion powered battery technology fueling the green revolution? See how much of the metal is in various everyday devices in this infographic. Read more
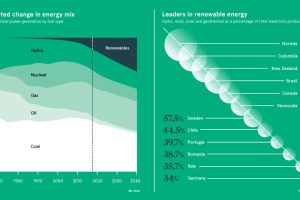
The race towards a fully green future is heating up. As declining prices drive up the adoption of renewable energy, which countries are investing the most? Read more

Legal cannabis cultivation emits as much CO2 as 92,660 cars annually. Growing cannabis sustainably can reduce this massive environmental footprint. Read more
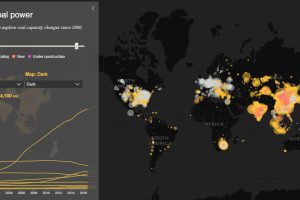
Today’s interactive map shows all of the world’s coal power plants, plotted by capacity and carbon emissions from 2000 until 2018. Read more
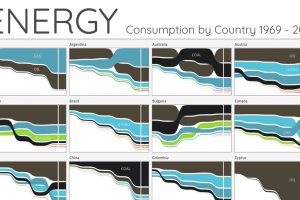
For the last 50 years, fossil fuels have dominated energy consumption. This chart looks at how the energy mix is changing in over 60+ countries. Read more

