

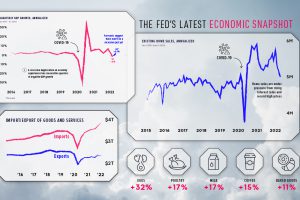
Stay up to date on the U.S. economy with this infographic summarizing the most recent Federal Reserve data released. Read more
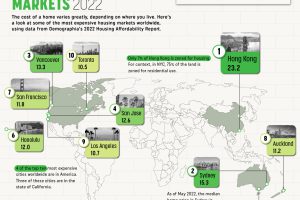
An analysis of 90+ major cities reveals which ones are the least affordable housing markets based on their price-to-income ratio. Read more
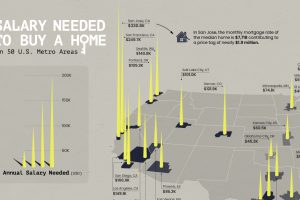
Is owning a home still realistic? This map lays out the salary you’d need to buy a home in 50 different U.S. metro areas. Read more
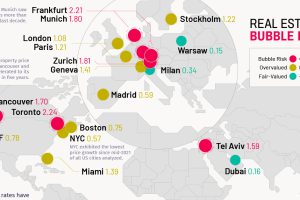
A global look at which cities have the most overheated real estate markets. Toronto shows the highest bubble risk in 2022. Read more

There’s more to consider than the price tag when purchasing a house. This ranking reveals the most affordable U.S. cities for home buyers. Read more
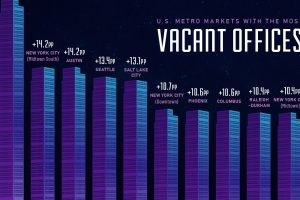
This visual showcases the top ten U.S. downtown areas with the fastest growing rate of vacant offices from the pre-pandemic era to 2023. Read more
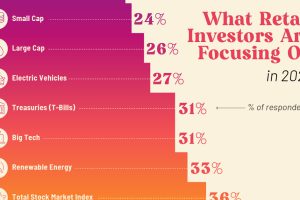
What key themes and strategies are retail investors looking at for the rest of 2023? Preview: AI is a popular choice. Read more

This graphic shows how the ultra-wealthy invest their fortunes, from real estate and equities to luxury items. Read more
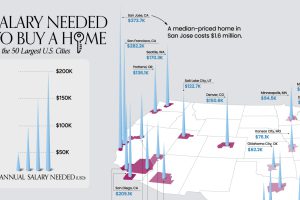
What does it take to own a home in the U.S. in 2023? Here’s a look at the salary needed for home ownership in the top 50 metro areas. Read more

Services-producing industries account for the majority of U.S. GDP in 2023, followed by other private industries and the government. Read more