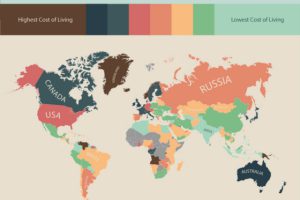
The most expensive and cheapest places to live, sorted by country. Compiled using hundreds of thousands of user submitted price data. Read more

How does the psychology of prices affect buying behavior? In this infographic, some typical methods are shown, and we ask if it applies to investing. Read more
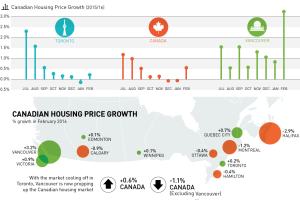
There’s only one pillar left holding up the Canadian housing market. Without Vancouver, housing prices would have declined nationally by -1.1% in February. Read more
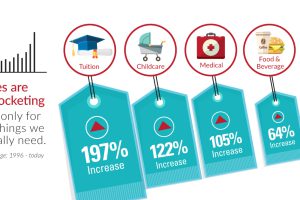
Over the last 20 years, the things that are the most important to us, such as healthcare, education, food, and shelter, have skyrocketing prices. Read more
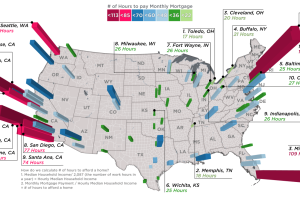
Every month, the average New Yorker needs 113.5 hours of work to pay down a mortgage, while in Memphis it’s just 18.4 hours. Read more
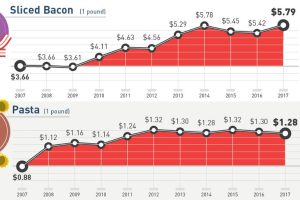
How much more expensive are basic staples than they were 10 years ago? This infographic tracks grocery prices for 30 common items like cheese, fruit, and eggs. Read more
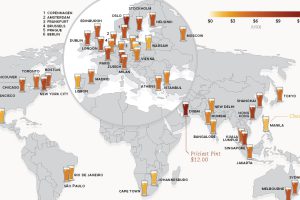
This data on the price of beer is fresh from the tap. See how much a pint of beer costs in 48 different major cities around the world. Read more
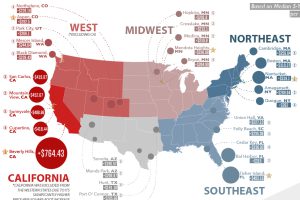
Here are the biggest increases in median housing prices (per sq. ft) over the last 5 years. See where real estate prices are rising (and falling) the fastest. Read more
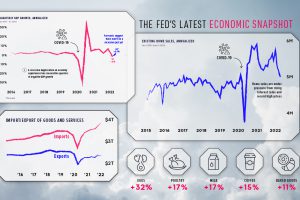
Stay up to date on the U.S. economy with this infographic summarizing the most recent Federal Reserve data released. Read more
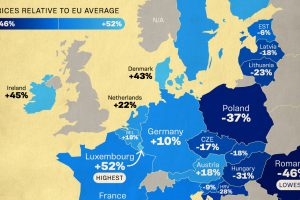
Which EU countries are the cheapest and the most expensive? See how prices compare relative to the EU average. Read more

