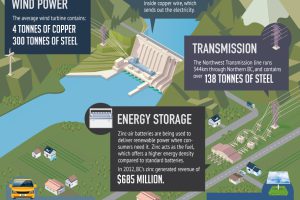
Part of the Mining Builds British Columbia series presented by the Mining Association of BC. About Mining Builds British Columbia Everything used by British Columbians in their everyday lives is… Read more

In this Powering New York slideshow, we visualize what it takes to power NYC with every type of energy including gas, wind, solar, nuclear, and more. Read more
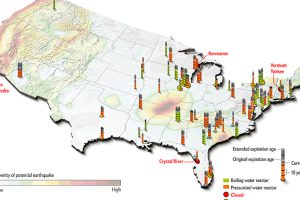
It’s no secret that China plans to build dozens of nuclear reactors in the coming years. Domestically, nuclear has taken a back seat in the United States. Read more
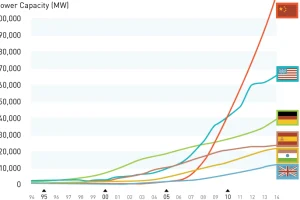
The most recent statistics show that China now has more total wind capacity than the United States, India, and Spain combined. Read more
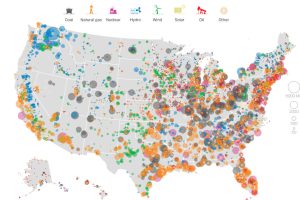
This series of data visualizations shows how the United States has generated its electricity so far in 2015 by energy source and size of each power plant. Read more
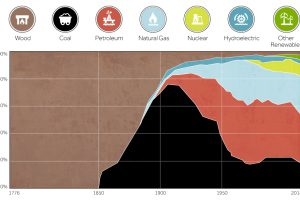
This chart shows the history of America’s energy supply based on energy source. This brief history covers all from wood-powered locomotives to solar panels. Read more
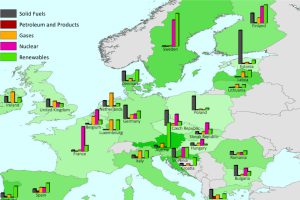
This series of charts and maps show an overview of Europe’s energy consumption, as well as consumption (per capita) by country and source. Read more
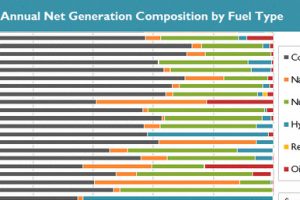
See in this .gif animation how much the U.S. electricity grid has evolved over the last two decades. Read more
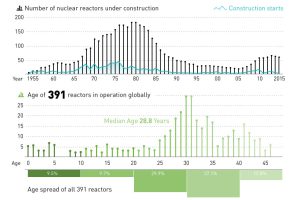
The majority of the 391 nuclear reactors in global operation were built many years ago, and aging reactors are beginning to be a problem for the industry. Read more

Which new sources of energy have promise? This infographic highlights the upcoming technologies that may provide the alternative energy sources of the future. Read more

