


The percentage of the global population that is 65+ will double from 10% to 20% by 2050, creating potential economic headwinds especially for millennials. Read more
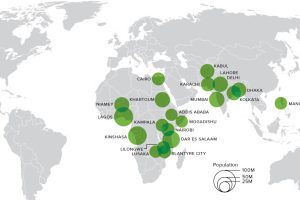
This animation shows big changes in the world’s most populous cities over the next 80+ years. Africa alone will hold 13 cities bigger than NYC by this time. Read more
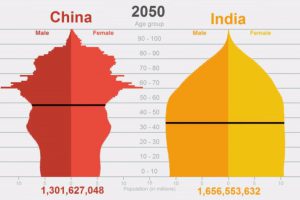
Unintended effects of China’s population control policies, the challenges of Chinese demographics, and a new population paradigm where India sits up top. Read more
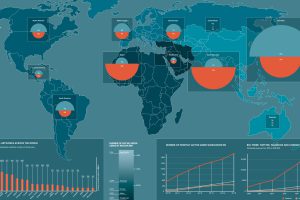
How representative is social media of actual regional geographic populations? This map compares both numbers side by side with interesting results. Read more
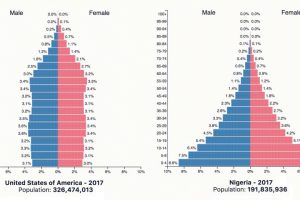
The world’s 10 most populous countries may all have many millions of people, but their future growth prospects are very different. Read more
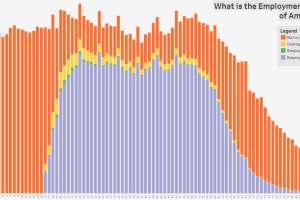
These three charts show the age distribution of the U.S. population, further broken down by employment status, education, and marital status. Read more
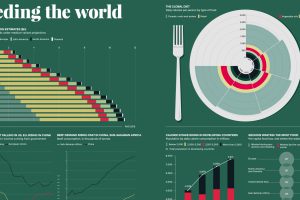
The global population will grow by billions in the coming years – but more importantly, the global diet is changing rapidly, as well. Read more
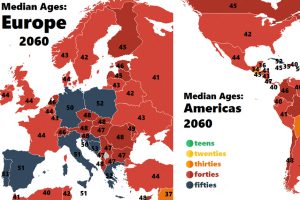
How fast are countries in Europe and the Americas aging? These colorful animations show how the median age is projected to change up until the year 2060. Read more
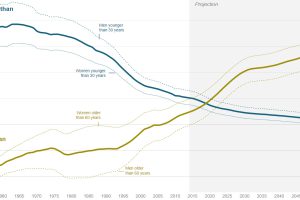
By 2019, the country will have a higher 60+ year old population than its 30 and under crowd. This series of charts shows the demographic outlook for Germany. Read more

How have state populations changed over a century? This bump chart shows the population rank of every state in the United States over 1917-2017. Read more