
Visualizing plastic waste per capita reveals a surprising list of countries that you may not have expected. Read more
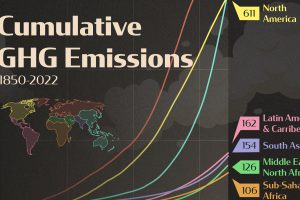
Just three regions have contributed 79% of global cumulative GHG emissions since 1850. See where they are in this graphic. Read more
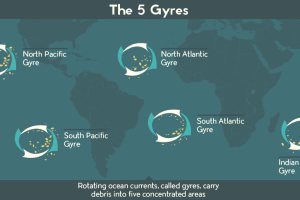
There is a staggering amount of plastic debris swirling around our oceans. This infographic and video help put this plastic problem in perspective. Read more
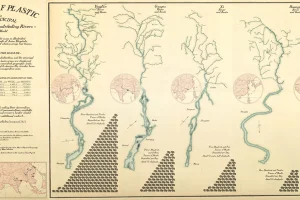
Every year, 8 million metric tons of plastic enters the world’s oceans – much of it through our river systems. See which rivers are polluting the most. Read more
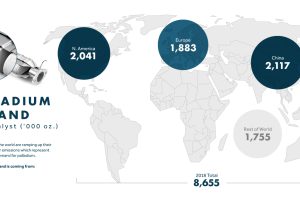
The world is in critical need of palladium. It’s a crucial metal in reducing emissions from gas-powered vehicles, and our secret weapon for cleaner air. Read more
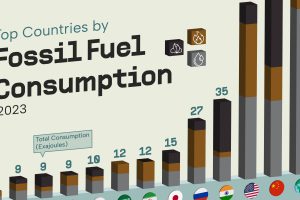
China and the U.S. account for nearly half of fossil fuel use. Read more
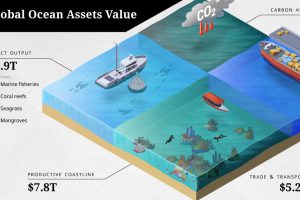
The ocean economy is under threat. How are human activities impacting the sustainable use of our ocean assets, valued at over $24 trillion? Read more
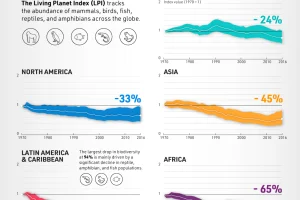
Earth’s biodiversity has seen a significant drop over the last few decades. But the rate of biodiversity loss differs from region to region. Read more

1.6 billion face masks entered our oceans in 2020, representing 5,500 tons of plastic pollution. Read more
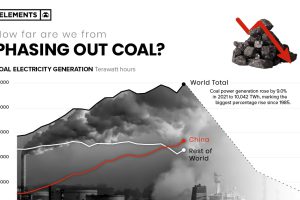
In 2021 coal-fired electricity generation reached all-time highs, rising 9% from the year prior. Here’s what it’d take to phase it out of the energy mix. Read more

