
Visualizing plastic waste per capita reveals a surprising list of countries that you may not have expected. Read more
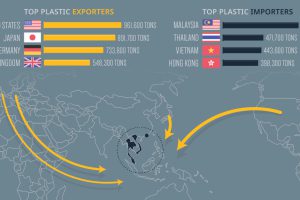
Every year, the United States exports almost one million tons of plastic waste, including ‘recycled’ materials. Where does all of this waste go? Read more
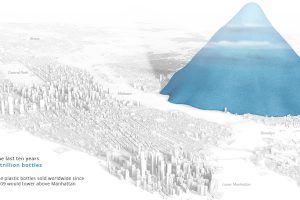
Today’s stunning visualization depicts the incredible scale of plastic bottle waste accumulated globally in each hour, day, month, year, and decade. Read more
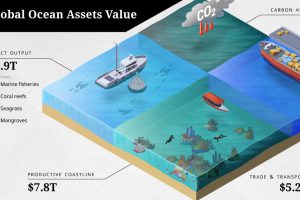
The ocean economy is under threat. How are human activities impacting the sustainable use of our ocean assets, valued at over $24 trillion? Read more
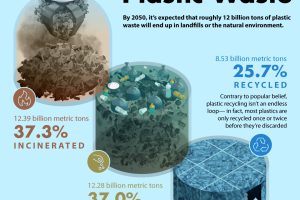
By 2050, about 37% of all the world’s plastic waste is expected to end up in our landfills or in the natural environment. Read more
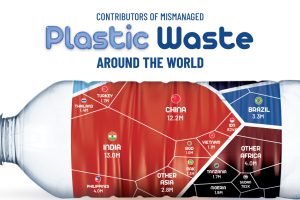
About 22% of the world’s annual plastic waste generation is mismanaged. Here’s a break down of mismanaged plastic waste by country. Read more

