

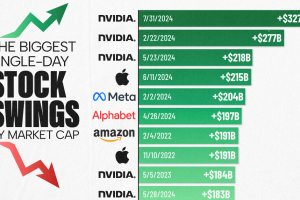
One company dominates this ranking of the biggest single-day stock swings in U.S. history. Read more
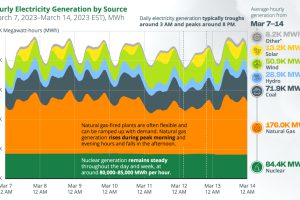
This chart tracks U.S. hourly electricity generation over one week, with various sources producing electricity at different times of the day. Read more
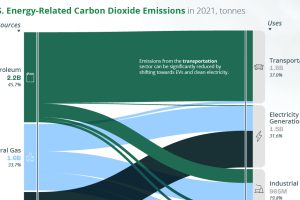
A look at the flow of energy-related CO2 emissions from the sources that generate energy to the sectors that use it. Read more
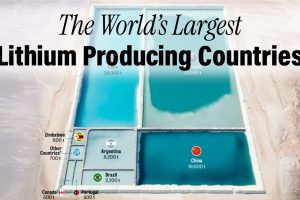
Which countries produce the most lithium, and which have the most in reserves in the ground? We look at 2022 data from the USGS. Read more
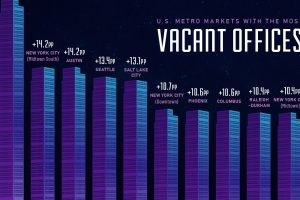
This visual showcases the top ten U.S. downtown areas with the fastest growing rate of vacant offices from the pre-pandemic era to 2023. Read more
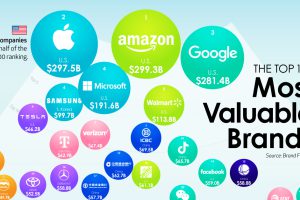
We show the top companies by brand value—and the brands that are rising the fastest as consumer expectations shift. Read more
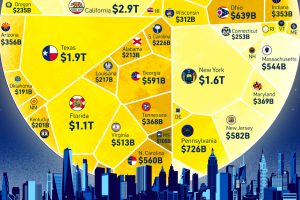
How does each state contribute to America’s overall GDP? This visualization breaks down the U.S. economy by state. Read more
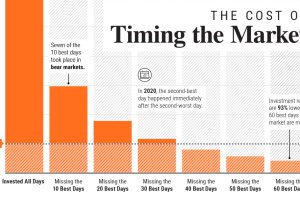
In this graphic, we show why timing the market is extremely difficult, and how it can meaningfully dent portfolio returns. Read more
Join VC+ Lifetime this month and get the best visual insights for the best value. See what else VC+ members receive in August! Read more

How much does each country contribute to the $105 trillion world economy in 2023, and what nations are seeing their nominal GDPs shrink? Read more