What could happen after rates are cut? Find out in our exclusive visual guide to the markets in September. Read more
Employees at big tech companies and financial firms dominate in political donations ahead of the 2024 U.S. presidential election. Read more
Our exclusive visual guide to the state of global wealth. Read more
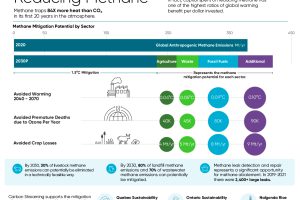
Methane emissions contribute to over half of net global warming. Where do the greatest opportunities lie for methane abatement? Read more
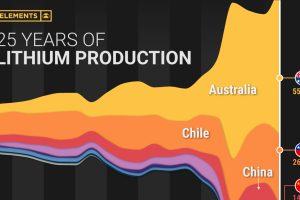
Lithium production has grown exponentially over the last few decades. Which countries produce the most lithium, and how how has this mix evolved? Read more
Get our visual breakdown of trends in global and U.S. migration, only with VC+ by Visual Capitalist Read more
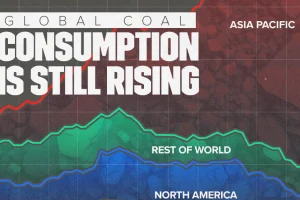
China remains the largest coal consumer, making up 56% of the global total. Read more
Dive into the world of Gen Z with our Special Dispatch, only with VC+ by Visual Capitalist Read more


