

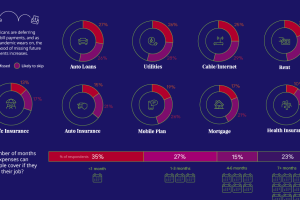
57% of U.S. consumers’ incomes have taken a hit during the pandemic. How do such financial anxieties affect the ability to pay bills on time? Read more
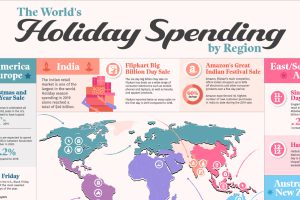
This graphic illustrates some of the largest and most anticipated retail holidays by region and explores their origins. Read more
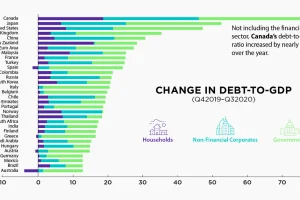
The battle against the COVID-19 pandemic has resulted in heightened debt-to-GDP levels across all sectors and countries. Read more

This graphic compares consumers’ most loved brands before the COVID-19 pandemic to their most loved brands during the pandemic. Read more
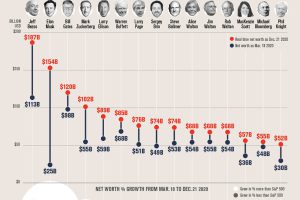
The net worth of some American Billionaires has grown substantially since the COVID-19 market bottom. Here’s how much their fortunes grew. Read more
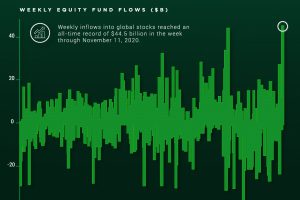
Investor optimism regarding vaccine news and the U.S. presidential election has led to record breaking inflows into the stock market. Read more
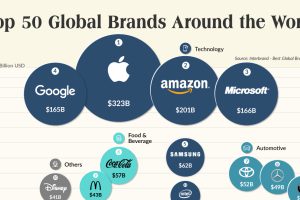
This graphic showcases 2020’s top 50 most valuable global brands and explores how COVID-19 has triggered a brand shift with huge implications. Read more
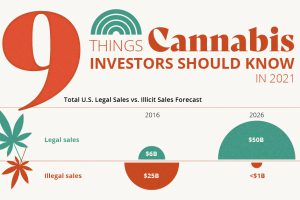
This graphic provides an overview of 9 key developments in the cannabis industry that investors should be aware of going into 2021. Read more
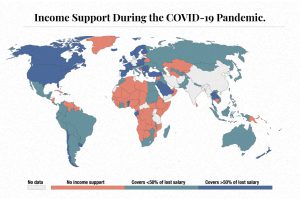
The need for income support during COVID-19 has been vast. This map visualizes different levels of income support around the world. Read more
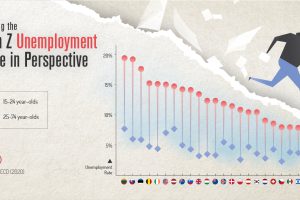
COVID-19 has impacted everyone, but one generation is taking it harder than the others. This graphic reveals the Gen Z unemployment rate. Read more