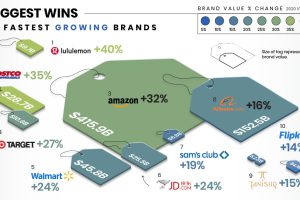
This infographic illustrates how the fastest growing and declining retail brands are attempting to stay relevant in the pandemic economy. Read more
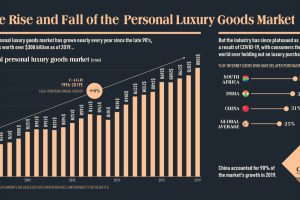
This infographic charts the rise and fall of the $308 billion global personal luxury market, and explores what the coming year holds for its growth Read more
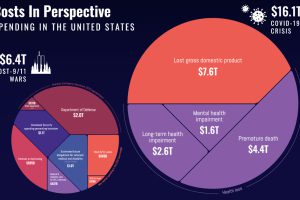
Putting the Economic Cost of COVID-19 in Perspective When it comes to the toll on human life, mental well-being, and any long-term complications, the true cost of COVID-19 can be… Read more
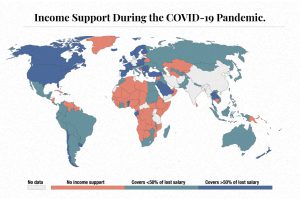
The need for income support during COVID-19 has been vast. This map visualizes different levels of income support around the world. Read more
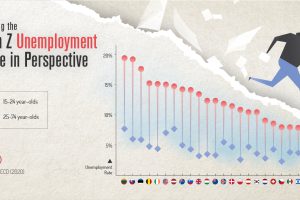
COVID-19 has impacted everyone, but one generation is taking it harder than the others. This graphic reveals the Gen Z unemployment rate. Read more
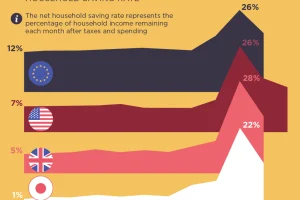
Were people more frugal during the pandemic or did they break the bank? This visual assesses the saving rates across different countries. Read more
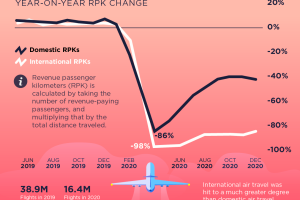
In spring 2020, roughly two-thirds of the world’s passenger jets were grounded. Here’s how things have rebounded since the onset of the pandemic. Read more
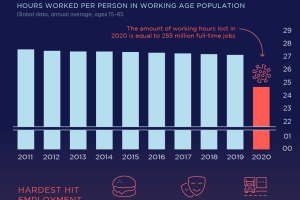
The pandemic has impacted employment greatly. This visual reveals how its effects have led to losses in hours worked by global workers in 2020. Read more

It’s been a long year since the WHO declared the novel coronavirus a global pandemic. This visual looks at key events in the COVID-19 timeline. Read more
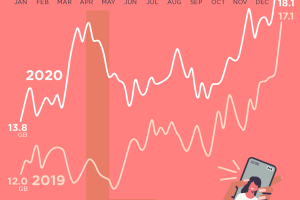
Data usage across America peaked in April 2020, but reached relatively normal levels by the end of the year. Read more

