

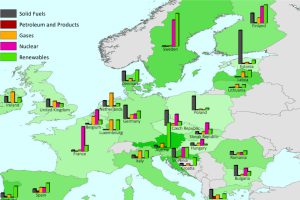
This series of charts and maps show an overview of Europe’s energy consumption, as well as consumption (per capita) by country and source. Read more
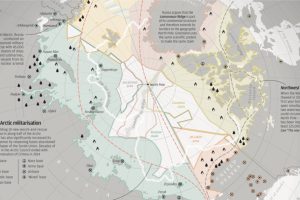
With Arctic ice thawing, the race for natural resources, shipping routes, and other territorial claims is heating up. The race for Arctic Domination is on. Read more
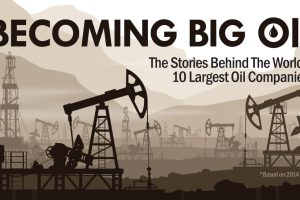
The 10 largest oil companies generated a massive $3.26 trillion in revenue last year. How did Big Oil come to be? This infographic takes a look. Read more
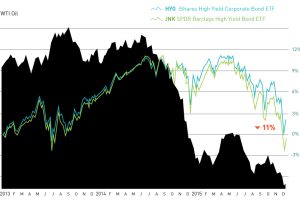
The month of December so far has seen a mini-meltdown in the junk bond market. The culprit? Fringe oil and gas producers that are struggling with low prices. Read more
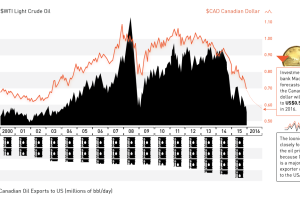
The oil plunge has wreaked havoc on the Canadian dollar. Now at 13-yr lows and expected to go lower, we explain the relationship between oil and the loonie. Read more
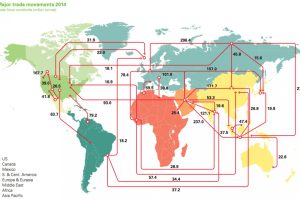
Every day, 93 million barrels of oil are consumed by the global economy. How does this oil change hands? This map visualizes the global oil trade. Read more
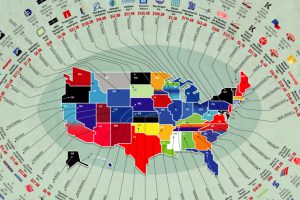
The biggest businesses in the U.S. range from oil producers to retail giants. Here’s a list showing the largest company in each state by revenue. Read more
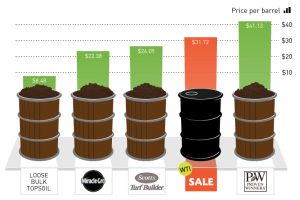
It costs the same amount as a barrel of Scotts Turf Builder. Read more
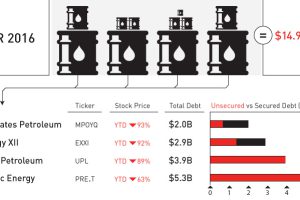
April was a record-setting month for bankruptcies in the oil patch. We put the 11 bankruptcies and $15 billion of outstanding debt in context. Read more
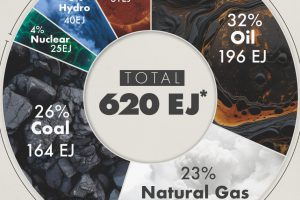
This graphic shows the sources of energy used globally in 2023, measured in exajoules, with fossil fuels making up 81% of the energy mix. Read more