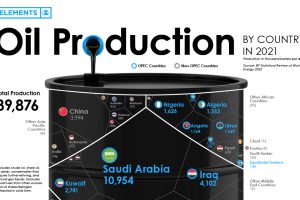
Global oil production averaged 89.8 million barrels of oil per day in 2021. Here are the world’s largest oil producers. Read more
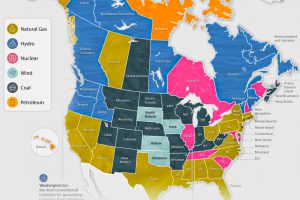
The U.S. and Canada rely on a different makeup of sources to generate their electricity. How does each state and province make theirs? Read more
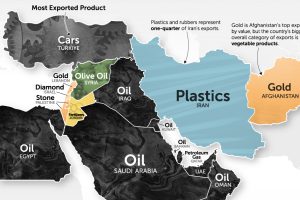
It’s more than just oil. This map of Middle East exports shows the top global product of each country by value. Read more

What are India’s top companies? This graphic showcases the country’s largest 50 publicly traded companies by market capitalization. Read more
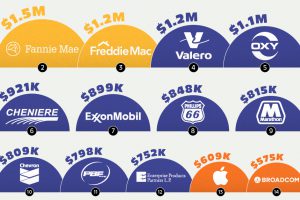
Which companies and sectors generate the most profit per employee? We rank the top 25 companies in the U.S. based on this interesting metric. Read more
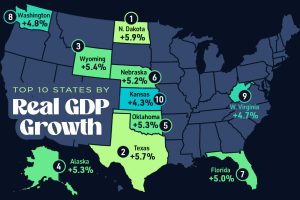
This graphic shows the states with the highest real GDP growth rate in 2023, largely propelled by the oil and gas boom. Read more

