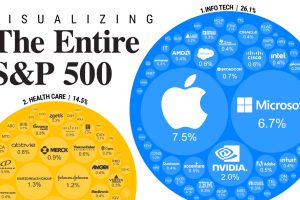
S&P 500 companies make up $34 trillion in market value combined. This graphic shows how they break down by weight and sector. Read more
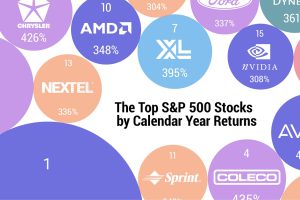
The highest one-year return among the top S&P 500 stocks from 1980 to 2022 was a staggering 2,620%. Which stocks top the ranks? Read more
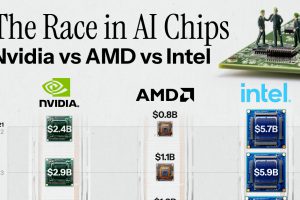
The generative AI boom is powered by processors. How have AI chip sales grown over the last two years among Nvidia vs AMD vs Intel? Read more
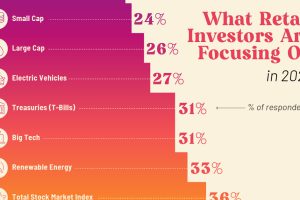
What key themes and strategies are retail investors looking at for the rest of 2023? Preview: AI is a popular choice. Read more
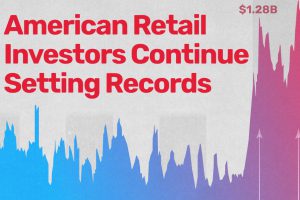
Considered a side show in the stock market for much of the last decade, U.S. retail investors are now breaking records. Read more
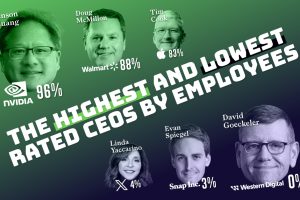
Social network Blind polled 13,000+ respondents on whether they approved or disapproved of the way their CEO handled the job, generating the approval rating of more than 100 CEOs. Read more
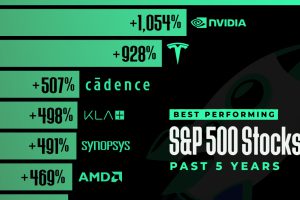
In this graphic, we’ve ranked the top S&P 500 stocks based on their 5-year total returns, as of November 2023. Read more


