

China has grown its nuclear capacity over the last decade, now ranking second on the list of top nuclear energy producers. Read more
Visualizing the Changing Landscape in Nuclear Power There’s been talk about a coming potential uranium bull market for awhile now, but here is a different look at the nuclear picture.… Read more
Which countries are turning to nuclear energy, and which are turning away? Mapping and breaking down the world’s nuclear reactor landscape. Read more
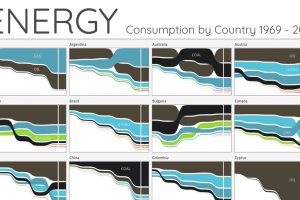
For the last 50 years, fossil fuels have dominated energy consumption. This chart looks at how the energy mix is changing in over 60+ countries. Read more
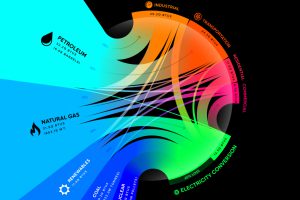
From renewables to fossil fuels, we’ve visualized the diverse mix of energy sources that powered U.S. energy consumption in 2020. Read more
Explore the age distribution of the 422 nuclear reactors operating globally in this infographic. Read more
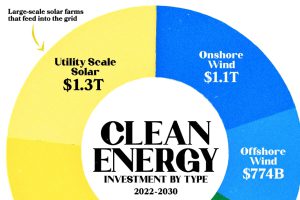
Global clean energy spending is projected to reach $5.6 trillion by 2030. Which renewable sources are forecast to see the most investment? Read more
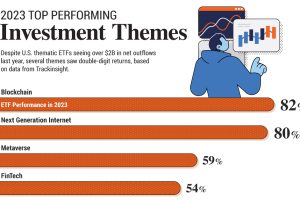
In 2023, several investment themes outperformed the S&P 500 by a wide margin. Here are the top performers—from blockchain to AI. Read more