

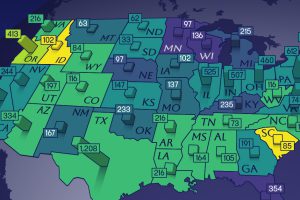
This map shows how many energy projects are in interconnection queues by state and how long these projects have been queued up, on average. Read more
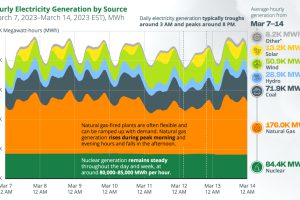
This chart tracks U.S. hourly electricity generation over one week, with various sources producing electricity at different times of the day. Read more
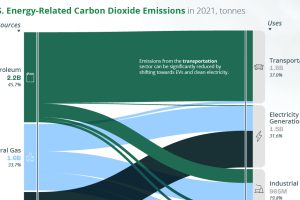
A look at the flow of energy-related CO2 emissions from the sources that generate energy to the sectors that use it. Read more

Here’s a preview of the 2023 Utility Decarbonization Index, which tracks the decarbonization progress of the largest U.S. utilities. Read more
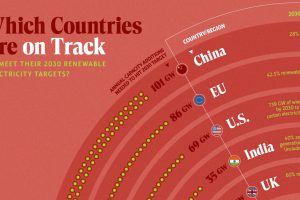
In this graphic, we visualize whether major electricity-consuming countries are on track to meet their 2030 renewable energy targets. Read more
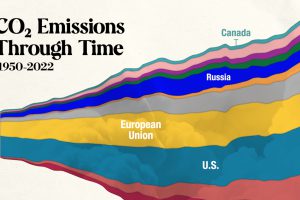
In this streamgraph, we break down global CO2 emissions between 1950 and 2022 using data from Berkeley Earth and Global Carbon Project. Read more

In this set of three maps, we show the global temperature rise on a national level for 2022, 2050, and 2100 based on an analysis by Berkeley Earth. Read more
Despite concerns about nuclear waste, high-level radioactive waste constitutes less than 0.25% of all radioactive waste ever generated. Read more
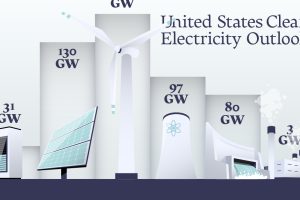
In this graphic, we explore the projected generation capacity of different clean electricity technologies in the U.S. for 2023 and 2024. Read more