


In this Powering New York slideshow, we visualize what it takes to power NYC with every type of energy including gas, wind, solar, nuclear, and more. Read more
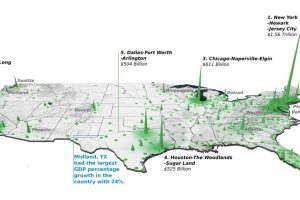
Did you know that the Top 20 metropolitan areas in the U.S. contribute 52% of the total country’s GDP? See how it breaks down by city in this 3d map. Read more

The Lone Star State has quite a few entrants on the latest fastest-growing American cities list. Read more
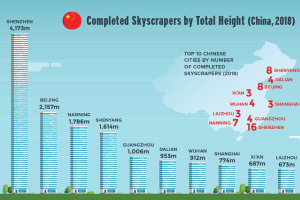
Nearly 150 skyscrapers were completed around the world last year. Find out which cities and regions are growing skyward the fastest. Read more
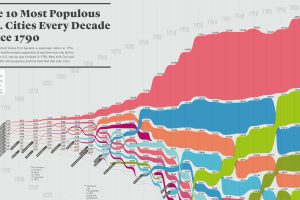
How has the list of the most populous U.S. cities changed over time? This infographic shows the top 10 cities of every decade since the year 1790. Read more
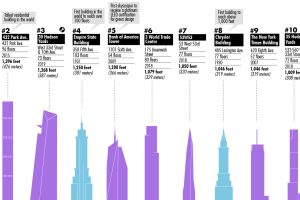
This visualization plots out the tallest buildings in New York City, as well as a few in the pipeline that will change the Big Apple’s skyline forever. Read more
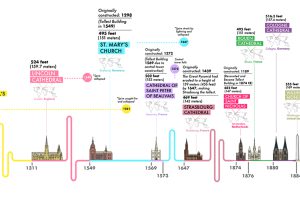
From the pyramids to the Eiffel Tower, our creations have scaled dramatically over the centuries. Which have been the world’s tallest structures in history? Read more
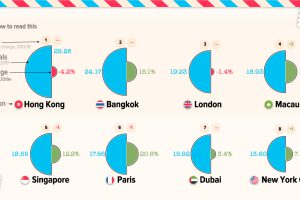
Even a pandemic can’t curb wanderlust—when tourism comes back, here are the most popular city destinations that will be seeing visitors. Read more
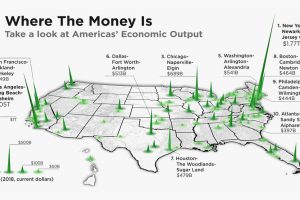
The total U.S. GDP stands at a whopping $21 trillion, but which metro areas contribute to the most in terms of economic output? Read more
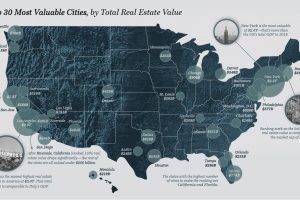
U.S. real estate value is concentrated in a handful of urban centers. Here’s a look at the top 30 most valuable cities. Read more