
From the heydays of the Dotcom boom, the number of tech IPOs has dropped steeply over the years. But 2021 saw a brief resurgence. Read more
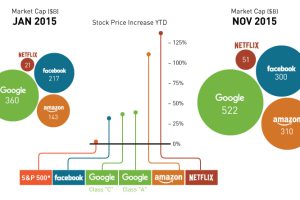
The FANG stocks (Facebook, Amazon, Netflix, and Google) are a group of tech companies that have carried the market this year, creating $440B in value YTD. Read more
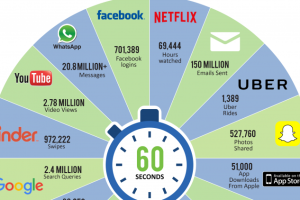
Here’s the mind-boggling amount of Google searches, Uber rides, and Facebook logins happen in an internet minute in 2016. Read more
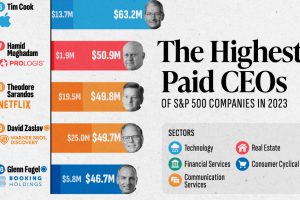
As median S&P 500 executive compensation hits record levels, we show the highest paid CEOs in America in 2023. Read more
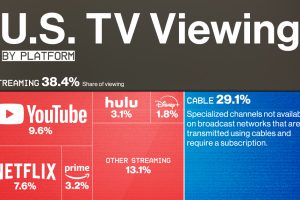
While broadcast and cable remain the most popular form of watching TV, streaming services are at near-record levels of U.S. TV viewership. Read more
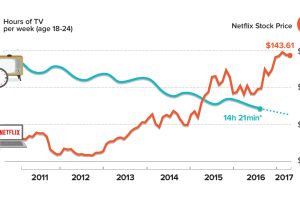
Cable television is slowly being killed by the digital natives, including millennials and Gen Z. Read more
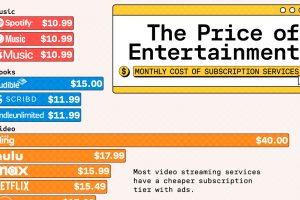
From Netflix to Google Play Pass, we compare the cost of subscription services across a range of entertainment platforms. Read more
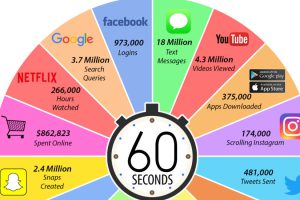
Not much happens in a minute of everyday life – but on the internet, it’s a different story! See the web’s scale visualized with this internet minute chart. Read more
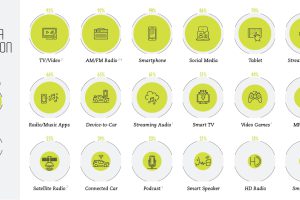
Americans spend an astonishing 12 hours per day consuming different types of media. Here are which media technologies are the most ubiquitous. Read more
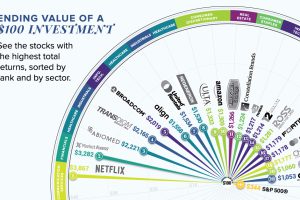
This graphic reveals the best-performing stocks over the last 10 years, and shows how much an initial $100 investment would be worth today. Read more

