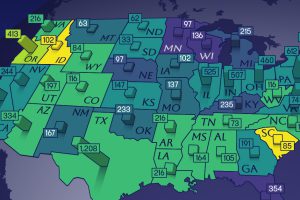
This map shows how many energy projects are in interconnection queues by state and how long these projects have been queued up, on average. Read more

Here’s a preview of the 2023 Utility Decarbonization Index, which tracks the decarbonization progress of the largest U.S. utilities. Read more

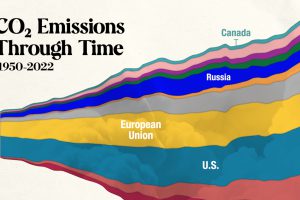
In this streamgraph, we break down global CO2 emissions between 1950 and 2022 using data from Berkeley Earth and Global Carbon Project. Read more

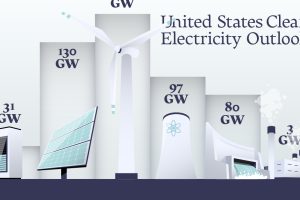
In this graphic, we explore the projected generation capacity of different clean electricity technologies in the U.S. for 2023 and 2024. Read more


