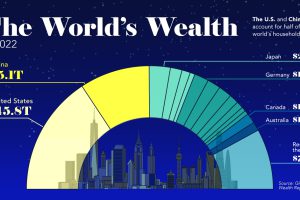
The U.S. and China Account for Half the World’s Household Wealth

This visualization breaks down how household wealth is distributed around the world. Just 10 countries now account for 75% of total household wealth. Read more
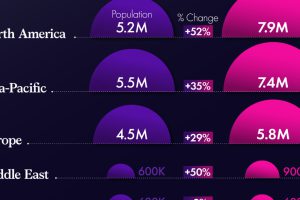
Charted: Millionaire Growth by Global Region

North America and the Middle East have experienced the largest percentage increase in the number of millionaires since 2016. Read more

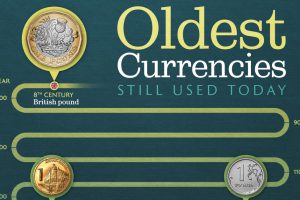
The 10 Oldest Currencies Still Used Today

The British pound dates back to around 775 AD. Read more

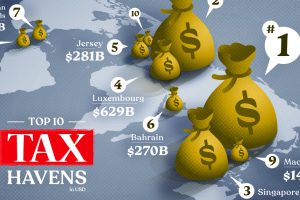
Ranked: The World’s Top 10 Tax Havens

Hong Kong tops the list with over $2.8 trillion. Read more

Mapped: The Purchasing Power of $100 in Each U.S. State

The purchasing power of money can vary by as much as 26% from state to state. Read more
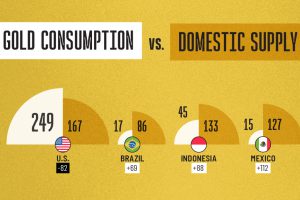
Visualizing Gold Consumption vs. Domestic Supply

India’s consumption is 50 times higher than its domestic supply. Read more

Ranked: The World’s Top Reserve Currencies in 2024

We breakdown $11.5 trillion in foreign exchange reserves to highlight the world’s top reserve currencies in 2024. Read more
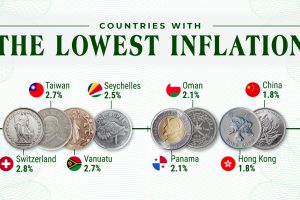
Which Countries Have the Lowest Inflation?

Just four economies around the world had inflation below 2% in 2022. We show the countries with the lowest inflation globally. Read more
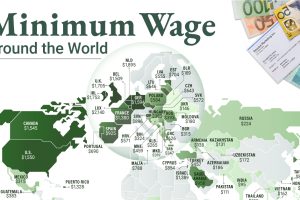
Mapped: Minimum Wage Around the World

This infographic shows the net minimum wage across 67 countries, as of January 2023. A breakdown by U.S. state is also included. Read more

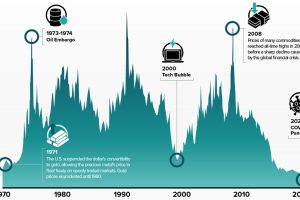
Charted: Commodities vs Equity Valuations (1970–2023)

The commodities-to-equities ratio recently hit a 50-year low. In the past, when this ratio reached such levels, commodity supercycles began. Read more