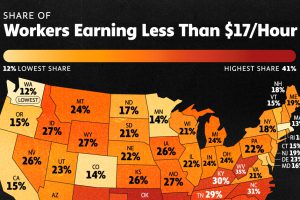
Today, 30.6 million Americans are low-wage workers. In this graphic, we show the share of the workforce earning under $17 an hour, by state. Read more

This infographic shows the net minimum wage across 67 countries, as of January 2023. A breakdown by U.S. state is also included. Read more

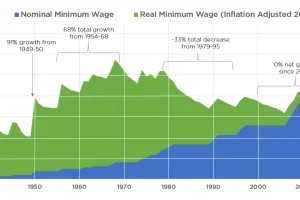
This graphic compares the nominal vs. inflation-adjusted value of the U.S. minimum wage, from 1940 to 2023. Read more

Here’s where workers earn the highest minimum wage in America as 22 states implement wage increases in 2024. Read more


