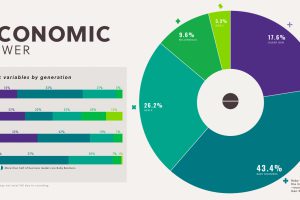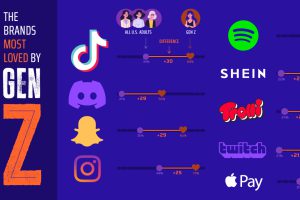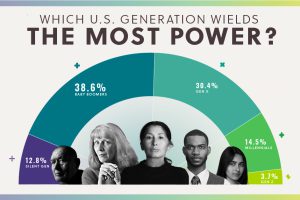
Using data from our new Generational Power Index, we look at how much economic, political, and cultural power each U.S. generation holds. Read more
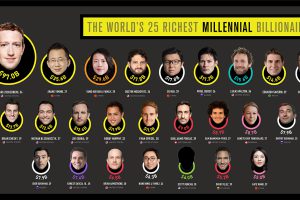
There are over 2,700 billionaires in the world, but how many are millennials? This visual breaks down the richest millennial billionaires. Read more
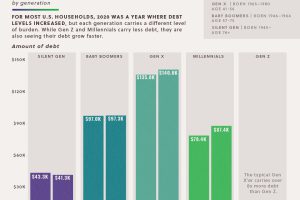
The majority of U.S. households saw debts rise in 2020. This data looks at the growth in household debt and the existing debt pile, by generation Read more
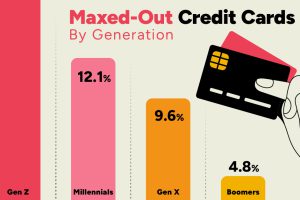
Younger credit card users tend to max out their credit cards more often than older generations, with 15% of Gen Z maxing out their cards. Read more
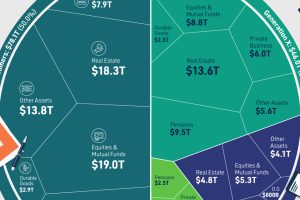
We’ve visualized data from the Federal Reserve to provide a comprehensive break down of U.S. assets by generation. Read more
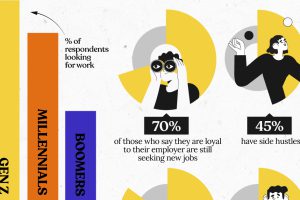
Gen Z job seekers are far more active than older generations, consistently looking for new work while already employed. Read more
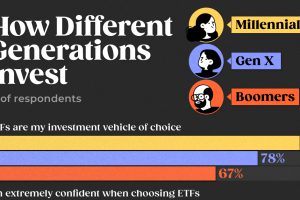
How personal are your investments? We chart investment preferences by generation in the U.S. based on a survey of 2,200 investors in 2023. Read more

Gen Z is expected to add almost $9 trillion in spending globally in the next 10 years, more than any other generation. Read more


