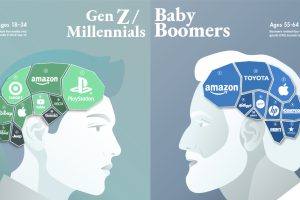
Can a brand transcend time and be all things to all people? This graphic seeks to find out by visualizing the most loved brands by generation. Read more
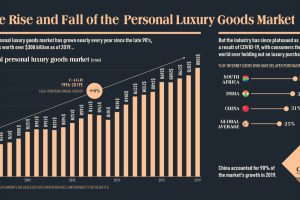
This infographic charts the rise and fall of the $308 billion global personal luxury market, and explores what the coming year holds for its growth Read more
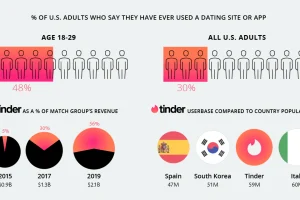
Online dating is a cultural force driven by Millennials and Gen Z. But it’s also a phenomenon dominated by just one company—Match Group. Read more
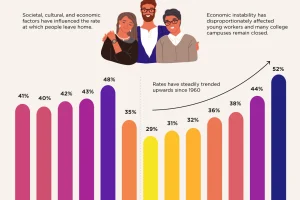
Today 52% of young adults aged 18-29 live with their parents. Economic and societal factors have played a part in addition to the COVID-19. Read more
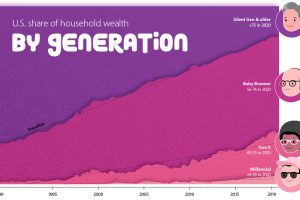
How large is the wealth gap between Millennials, Gen X, and Baby Boomers? We visualize the growing wealth disparity by generation and age. Read more
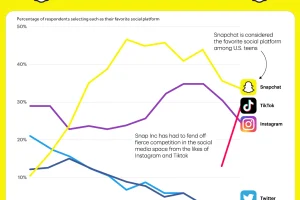
In today’s competitive social media landscape, Snapchat is #1 with American teens, but TikTok is quickly closing the gap. Read more
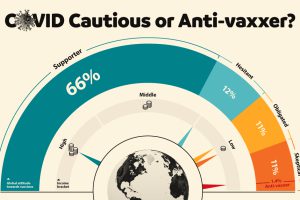
This graphic visualizes global attitudes to vaccines categorized into five segments including anti-vaxxers and COVID cautious. Read more
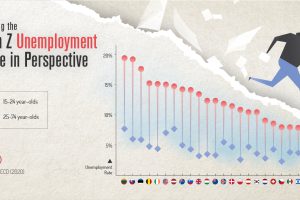
COVID-19 has impacted everyone, but one generation is taking it harder than the others. This graphic reveals the Gen Z unemployment rate. Read more
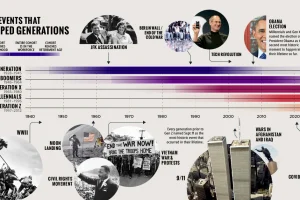
This timeline, from our Generational Power Index report, explores defining events in U.S. history that impacted each generation. Read more
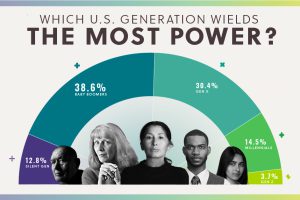
Using data from our new Generational Power Index, we look at how much economic, political, and cultural power each U.S. generation holds. Read more

