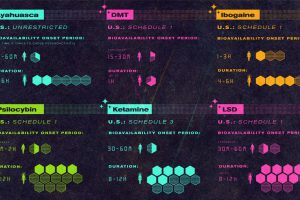
This infographic provides a simple overview of the seven most common psychedelic substances and explores their therapeutic potential. Read more
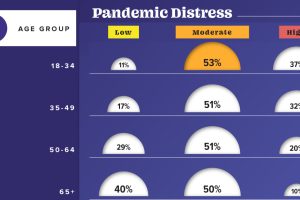
This graphic visualizes the impact of COVID-19 on emotional distress levels by different demographic subgroups such as race, education, or sex. Read more
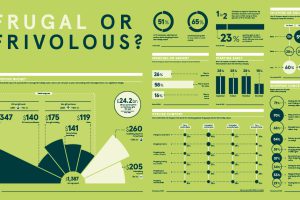
This graphic explores how festive spending in 2020 has changed as a result of the ongoing COVID-19 pandemic and evolving consumer behavior. Read more
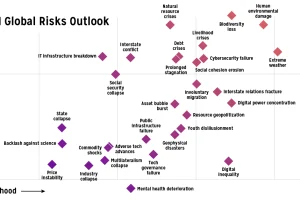
Which risks are top of mind in 2021? We visualize the World Economic Forum’s risk assessment for top global risks by impact and livelihood. Read more

After 17 days and 339 events, the Tokyo Olympics have come to an end. Here we visualize the final medal tallies for every participating country. Read more
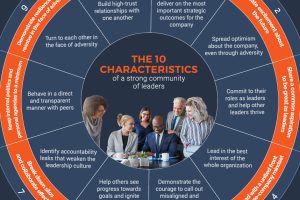
Feeling disconnected? This infographic teaches you how to build strong leadership communities in your organization in a hybrid working world. Read more
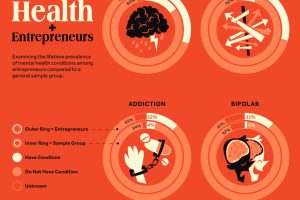
Research explores the link between entrepreneurship and mental health conditions such as ADHD and bipolar disorder Read more

